Gold Price Forecast: XAU/USD Tests $4,660–$4,700 Support as US-Iran Tensions
Gold has taken a hit of roughly 0.4-1% so far today and is on track to drop a further 2-3% for the week. We've seen it trading in a range...
Quick overview
- As of April 24th, 2026, spot Gold prices are fluctuating between $4708 and $4710 per ounce, reflecting a decline of approximately 0.4-1% today.
- Gold has increased by 35-40% over the past year but remains significantly below its all-time high of nearly $5600 earlier this year.
- Key factors influencing Gold prices include rising oil prices due to Middle East tensions, a stronger US dollar, and uncertainty surrounding US-Iran talks.
- Upcoming macroeconomic events, including the FOMC meeting and GDP data, could further impact Gold prices, with better-than-expected data likely reinforcing higher interest rates.
As of April 24th, 2026 mid-morning and early trading session has seen spot Gold prices hovering around the $4708-$4710 per ounce mark.
- Looking back on recent movement: Gold has taken a hit of roughly 0.4-1% so far today and is on track to drop a further 2-3% for the week. We’ve seen it trading in a range between $4650-$4770 of late.
- One year on and its doing better than that – Gold is up a pretty substantial 35-40%, but its still a far cry from its all time high near $5600 earlier this year.
Key Drivers Today
We can put it down to these three things:
- The impact of higher oil prices (which are being driven by tensions between the Middle East and the US and Iran) – this really is fueling fears over inflation and expectations of higher interest rates for a lot longer.
- A stronger US dollar and rising yields.
- Ongoing uncertainty surrounding the US Iran talks and the potential for a ceasefire in the Strait of Hormuz – and the potential inflation fallout from this.
Gold has had a bit of a boost at times thanks to bargain hunting and safe-haven flws, but overall the near term picture is still bearish.
Upcoming Macro Events Likely to Impact Gold (April 24th – 30th, 2026)
- Thursday and Friday April 28-29: Its the FOMC meeting and Powell press conference – markets will be looking for any clues on rates (currently sitting at 3.50-3.75%), how they see inflation and oil shocks playing out, and who might be likely to take over at the Fed.
- April 30th: Q1 GDP (preliminary), PCE Deflator and personal income/spending – this is going to give us a good idea of how inflation and growth are looking.
- Early May: April CPI and PPI releases – this is going to be key for seeing if the war is having the impact on inflation that we’re expecting.
Better than expected data is likely to reinforce higher interest rates, which won’t be good for Gold, but weaker data might help to bolster safe-haven flows.
Gold (XAU/USD) Technical Analysis
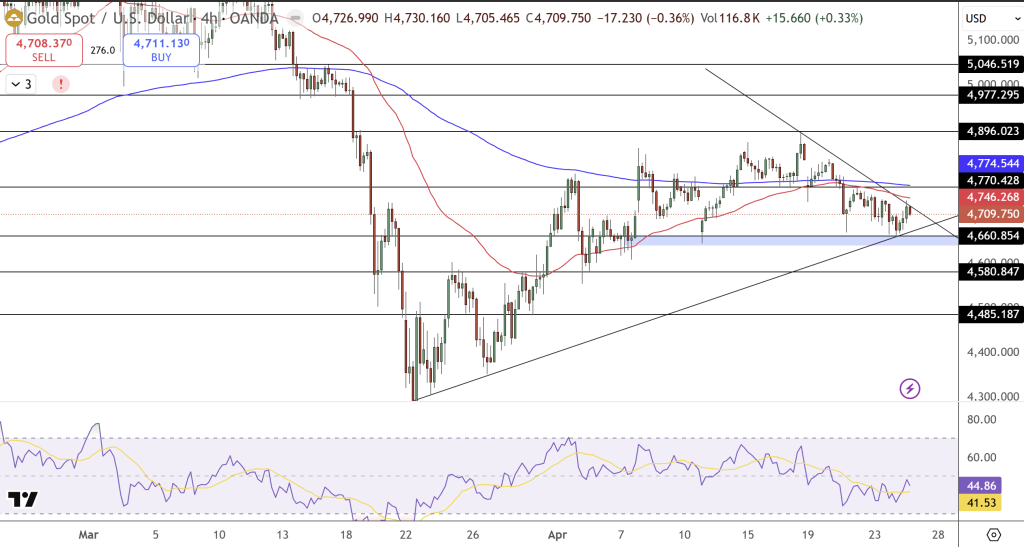
GOLD on the 2 hour chart is showing some pretty clear pressure on the downside, having broken below both the 50 EMA ($4738) and 200 EMA ($4748) – which confirms a short term bearish shift. Right now the price is around $4678 and is slowly working its way down into the $4660 demand zone.
The trendline from the recent high near $4880 continues to cap any sort of upside, and the RSI is hovering at 37 which is bearish but not yet too far down.
Key Levels:
- Resistance: $4738-$4748 -> $4780
- Support: $4660->$4580->$4485
Trade Idea: Sell below $4660 targeting $4580 with a stop in place just above $4738.
- Check out our free forex signals
- Follow the top economic events on FX Leaders economic calendar
- Trade better, discover more Forex Trading Strategies
- Open a FREE Trading Account
- Read our latest reviews on: Avatrade, Exness, HFM and XM
Related Articles


Sidebar rates
Related Posts
Ava

