Gold Price Rebounds to $4,730–$4,760 as US-Iran Ceasefire Extension Eases Tensions – $4,780 Breakout Next?
As of April 23rd 2026, a Thursday, spot gold has shown some resilience and is still refusing to budge below the $4700 mark...
Quick overview
- As of April 23rd, 2026, spot gold remains resilient, trading between $4750 and $4780 after bouncing back from recent lows.
- The extension of the US-Iran ceasefire has eased tensions, positively impacting gold prices amid lower oil prices and a weaker US dollar.
- Despite stalled peace talks, safe-haven investors continue to buy gold due to uncertainty in the Strait of Hormuz.
- Technical analysis shows gold is in a tight squeeze between key moving averages, indicating a potential for a significant price movement.
As of April 23rd 2026, a Thursday, spot gold has shown some resilience and is still refusing to budge below the $4700 mark , with some nice bounce back from one-week lows just a day or two ago . Trading in Europe just now has seen some decent gains and the price has hit a fresh high , we’re now ranging around $4750-$4780 – pretty much as expected after a spot of morning volatility earlier on.
Key things moving markets today
- US Iran Ceasefire Extension: On the news that Trump has put the brakes on the Iran ceasefire expiration date indefinitely (originally due to run out on the 22nd), the tensions between the two countries have eased somewhat – and that’s had a knock on effect on oil prices, worryingly low at the moment which is good news for gold bulls – inflation expectations are lower and interest rates are likely to remain firmly on hold.
- Stalled Peace Talks: Despite this renewal of the ceasefire, peace negotiations now seem to be on ice – Iran won’t come to the table unless the US agrees to lift the naval blockade on Iranian ports. This has created plenty of uncertainty over the Strait of Hormuz – and the usual safe-haven investors are still buying gold on the back of this, even though risk sentiment is slightly better than it was a few days ago.
- Macro Impact : With lower oil prices combined with a weaker US dollar, gold gets a welcome boost – countering higher inflation expectations and firmer bond yields which were really putting pressure on the price earlier.
Gold’s long term fundamentals remain pretty robust: there is still that steady demand coming in from central banks, some of the ETF’s are getting back on track, and of course, gold has that long term appeal as a inflation / geopolitical hedge. However at the moment, Hormuz headlines are driving the price and making it hard to see a real clear direction.
Gold (XAU/USD) Technical Analysis
On the 4 hour gold chart we have the price sitting just shy of 4.778, not a million miles from that key rising trendline which has been supporting the price for nearly a month now.
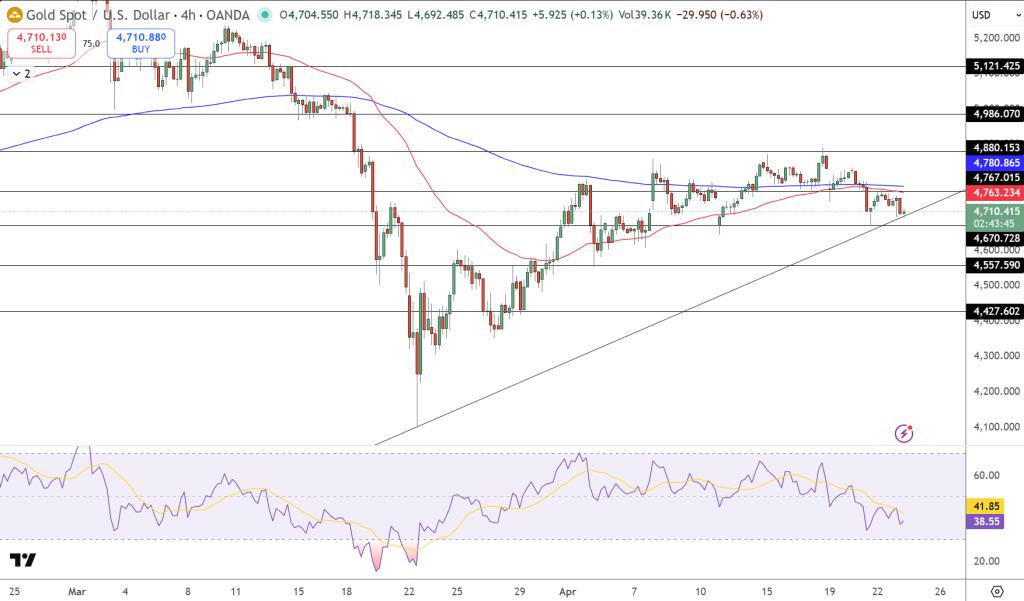
And the recent candles are showing us that buyers are trying to dig in and defend this level – after getting repeatedly rejected at that $4890 ceiling just a few days ago.
We’re now in a bit of a squeeze on the chart – with price sitting between those two main moving averages – the 50 period MA, just below $4780 is acting as a bit of a temporary barrier while the 200 period MA, around $4786 is capping any further gains – a classic tight squeeze – often precedes a big move.
Key Price Levels:
- Resistance: $4780 ->$4890 ->$4996
- Support: $4747 ->$4670 ->$4557
Trade Idea: Buy on a break above $4780 with a target of $4890 – stop below $4745.
- Check out our free forex signals
- Follow the top economic events on FX Leaders economic calendar
- Trade better, discover more Forex Trading Strategies
- Open a FREE Trading Account
- Read our latest reviews on: Avatrade, Exness, HFM and XM
Related Articles


Sidebar rates
Related Posts
