Gold Tests $4,660 Support as US-Iran Tensions and Oil Spike Weigh – Breakout or Deeper Drop Ahead?
Spot Gold Prices hover just above $4,670 - $4,700 an ounce, come midday on 24th April 2026, as trading gets underway...
Quick overview
- Spot Gold Prices are currently hovering between $4,670 and $4,700 an ounce, experiencing a decline of around 0.4-1%.
- Gold is on track for a disappointing week with a potential weekly loss of 2-3%, despite being up 35-40% compared to last year.
- Key factors influencing the market include rising oil prices, a stronger US dollar, and ongoing uncertainty in US-Iran relations.
- Technical analysis indicates a bearish trend for Gold, with resistance levels around $4738-$4780 and support near $4660.
Spot Gold Prices hover just above $4,670 – $4,700 an ounce, come midday on 24th April 2026, as trading gets underway.
- Gold has taken a hit today, down by around 0.4–1% & is on course for a pretty crappy week with a potential weekly loss of 2-3%. We’ve seen a tight range lately, of roughly $4,650-$4,770.
- If we look at the bigger picture – Gold prices remain pretty high compared to this time last year, up 35-40%+, although they’re nowhere near the all-time high of $5600 it reached way back in early 2026 at the start of the year.
Key Drivers to Watch
The squeeze on Gold is largely down to the following:
- The sharp rise in oil prices (due to the current tensions in the Middle East and the US-Iran situation) – which just so happens to be fuelling inflation fears & expectations that interest rates are going to stay high for even longer.
- A stronger US dollar & rising yields.
- US-Iran talks & ceasefire developments are still shrouded in uncertainty (focusing on the Strait of Hormuz and the potential implications for inflation) – with any movement sending shockwaves through the markets.
Protected by safe-haven flows & bargain-hunting at times, the overall near-term tone is a pretty bearish one – with a support level near the 21 day SMA ($4700) and resistance around $4750.
Gold (XAU/USD) Technical Analysis – What’s Going On?
On the 2H timezone, the price of Gold (XAU/USD) is looking pretty dismal – having broken below both the 50 day EMA and the 200 day EMA – which in turn confirms that we’re in short-term bearish territory.
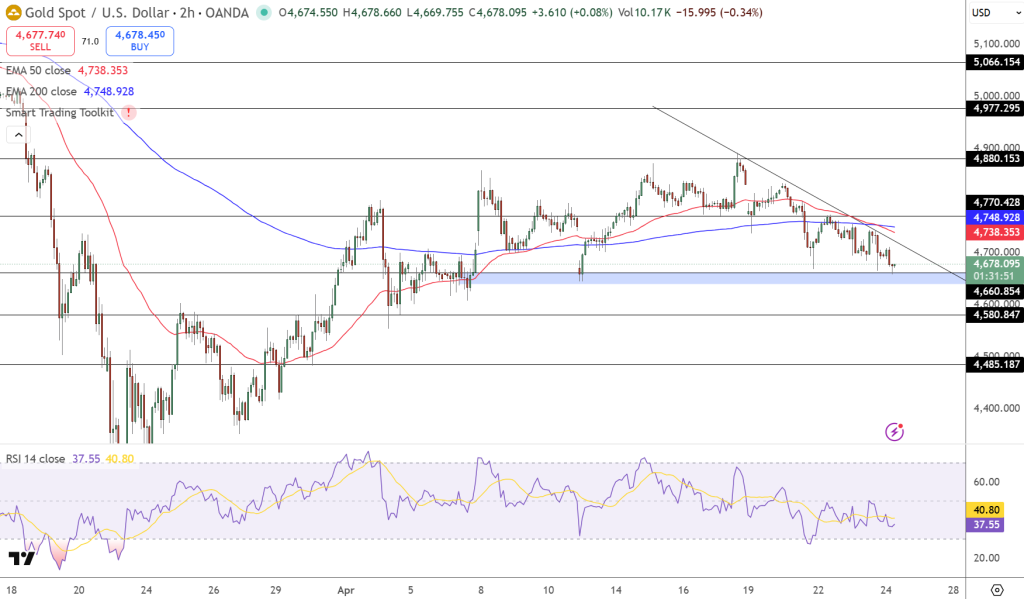
We’re currently trading around $4678 – & slowly pushing down towards the $4660 – which we know is a zone that price has acted as a base a few times recently.
There’s a clear downtrendline coming from the recent high of $4880 that’s keeping upside attempts firmly in check – & we’re seeing lower highs and lower lows beneath it – with this structure really pointing to sellers being firmly in control right now. The RSI is hovering around the low 30s – which means we’ve not yet reached the point of being overly oversold, giving us some wiggle room for further downside.
Key Levels to Watch
- Resistance: $4738-$4748 → $4780
- Support: $4660 → $4580 → $4485
Trade Idea: Sell if price drops below $4660 aiming for $4580 and set a stop loss above $4738.
- Check out our free forex signals
- Follow the top economic events on FX Leaders economic calendar
- Trade better, discover more Forex Trading Strategies
- Open a FREE Trading Account
- Read our latest reviews on: Avatrade, Exness, HFM and XM
Related Articles


Sidebar rates
Related Posts
