Bitcoin Battles $80,000 Resistance: Institutional Inflows and Stablecoin Liquidity Signal Potential Breakout
Bitcoin is exhibiting signs of a possible trend reversal after rising 30% from its bottom of $60,000 in 2026. However, analysts are warning
Quick overview
- Bitcoin has risen 30% from its 2026 low of $60,000, reaching $79,477 but facing resistance at the $80,000 mark.
- Institutional inflows have surged, with significant investments from spot Bitcoin ETFs and firms like MicroStrategy and Morgan Stanley.
- Technical analysts caution that Bitcoin is testing critical resistance levels, with a daily close above $80,000 needed to confirm a trend reversal.
- On-chain data shows increased stablecoin reserves, indicating potential sidelined capital ready to enter the market if confidence grows.
Bitcoin BTC/USD is exhibiting signs of a possible trend reversal after rising 30% from its bottom of $60,000 in 2026. However, analysts are warning that the decline is not over until the price breaks above $80,000.
This week, the world’s biggest cryptocurrency rose to $79,477, its highest point since late January. It then fell back near $77,000 before the weekly candle closure. The move has sparked more disagreement among traders and institutional observers over whether Bitcoin is really turning a corner or just having a bear-market relief rally.
Bitcoin Sees Strong Institutional Inflows
A lot of institutional buying has helped support the current rise in prices. In April, spot Bitcoin ETFs brought in $2.03 billion, and Strategy, which used to be called MicroStrategy, bought 34,000 more BTC for $2.54 billion. The MSBT Bitcoin ETF from Morgan Stanley got more than $153 million in its first two weeks of trading.
Eric Balchunas, a senior ETF analyst at Bloomberg, said that the ETF flows were “back in the high life.” He noted that every rolling tracking period the firm watches had turned positive, which hadn’t happened in months. BlackRock’s IBIT, the biggest spot Bitcoin ETF, has $3 billion in flows, putting it in the top 1% of all ETFs.
Bitwise CIO Matt Hougan made a more nuanced perspective, saying that long-only institutional flows have never really stopped during the recent slump. He said that the earlier outflows were due to a change in short-term basis trades and hot money, not a change in institutional conviction.
Investors are also taking into account the increased likelihood that the US Senate will pass the CLARITY Act before the midterm elections. This would provide the wider crypto business a clearer legal basis.
BTC/USD Technical Analysis: Critical Juncture Ahead?
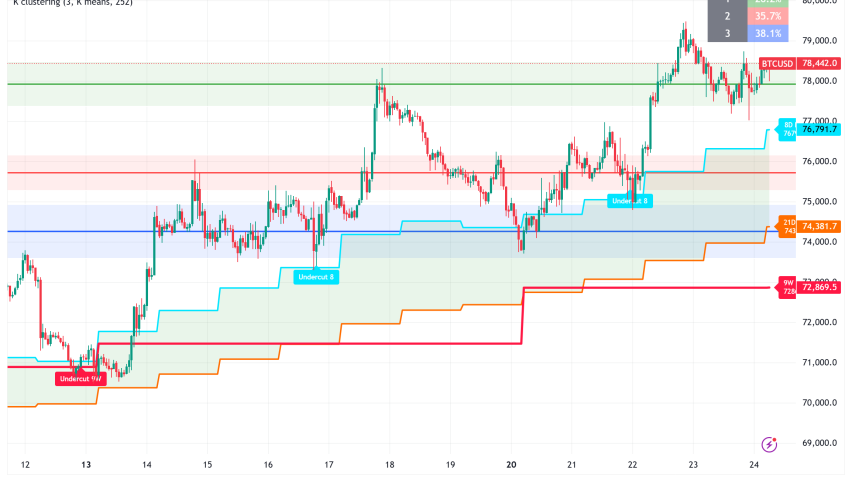
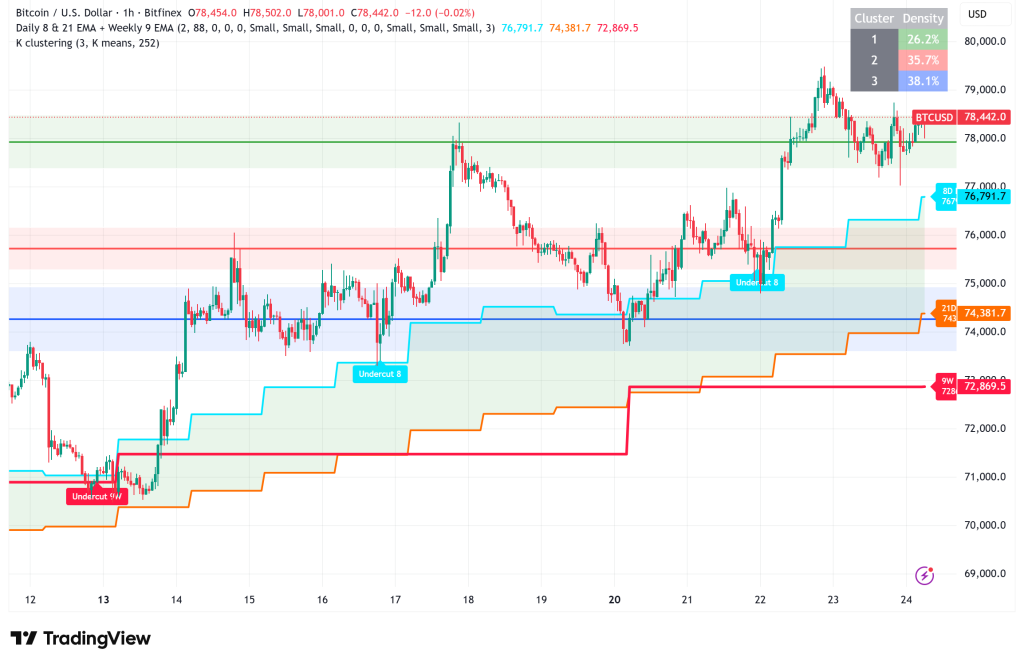
Even while things look good, chart analysts are still cautious. Aksel Kibar, a chartered market expert, pointed out a falling channel whose upper boundary has been rejected several times. The current price action is once again testing that resistance. A daily close above the $80,000–$83,000 zone for a long time is often seen as the minimum needed to prove that the structure has really broken.
Bitcoin is also trying to get back to its “bull market support band,” which is made up of the 21-week exponential moving average and the 20-week simple moving average. This is a technical milestone that many people are keeping an eye on. The pair has been trading below that band since October 2025, when Bitcoin reached its all-time high of $126,000. Traders are keeping a careful eye on the weekly close this weekend to see if it confirms.
Fidelity’s head of global macro Jurrien Timmer said that the comeback from the bottom of $60,033 still looked like a bear flag, which is a bearish continuation pattern, but he thought the end result might not follow the textbook reading. He remarked, “I think Bitcoin is still building a big base here in preparation for the next big up wave.”
Stablecoin Reserves Signal Sidelined Capital
On-chain data makes things even more interesting. As of April 21, USDC reserves on Binance had risen from a low of $4.5 billion in early March to $7.51 billion. This is a large amount of “dry powder” that might be quickly used if traders become more confident. The derivatives market is still leaning toward the pessimistic side, with the 30-day cumulative funding rate close to -4.5%, which means that a lot of traders are still betting against the rally. In the past, these kinds of bad funding situations have come before big price rises when short positions are forced out.
Bitcoin Price Prediction: Watch Macro Headwinds
The bigger picture is still hard to deal with. Markets see almost no likelihood that the Federal Reserve would lower rates at next week’s meeting. The ongoing US-Iran war and other geopolitical issues are also making the future look less certain. QCP Capital, a trading company, said that risk assets had pulled back from the edge, but the “underlying macro and geopolitical overhang has not been cleared.” Next week, important US inflation data could make things even more unstable.
The $80,000 threshold is still the line in the sand for now. “Floor moving higher,” said TRDR, a crypto charting service. Everyone is watching $80K.
- Check out our free forex signals
- Follow the top economic events on FX Leaders economic calendar
- Trade better, discover more Forex Trading Strategies
- Open a FREE Trading Account
- Read our latest reviews on: Avatrade, Exness, HFM and XM
Related Articles

Sidebar rates
Related Posts
