Gold Holds $4,750–$4,780 as US-Iran Tensions and Oil Spike Create Mixed Pressures – Breakout Above $4,780 Next?
On April 22, 2026, spot gold is holding steady above $4,700 and has bounced back from last week’s lows. During European trading...
Quick overview
- Spot gold is currently trading above $4,700, recovering from previous lows and fluctuating between $4,750 and $4,780.
- Mixed signals from the US-Iran situation are contributing to market uncertainty, particularly regarding oil supply through the Strait of Hormuz.
- Inflation concerns are rising due to increased oil prices, which is putting pressure on gold, although geopolitical risks maintain its safe-haven appeal.
- Technical analysis shows gold is near a rising trendline, with key support at $4,780 and resistance at $4,890.
On April 22, 2026, spot gold is holding steady above $4,700 and has bounced back from last week’s lows. During European trading, it reached new daily highs and is moving between $4,750 and $4,780 after some earlier volatility.
Key Drivers Today
- Mixed US-Iran Signals: President Trump announced the ceasefire with Iran will continue, which has eased tensions for now. However, the next round of peace talks in Pakistan has stalled because Iran refused to attend. The Strait of Hormuz is still a key area of concern. Conflicting reports about its status and ongoing naval tensions are keeping uncertainty high for global oil supply, which relies on this route for about 20% of seaborne crude.
- Inflation & Macro Pressures: Fresh worries about energy supply disruptions have driven oil prices up, bringing back inflation concerns and strengthening the U.S. dollar. This puts pressure on gold, which does not pay interest, although ongoing geopolitical risks still give gold some safe-haven appeal.
- Longer-Term Support: Ongoing central bank purchases and strong physical demand in Asia are helping to support gold prices. At the same time, worries about stagflation from energy disruptions remain.
Gold (XAU/USD) Technical Analysis
Gold (XAU/USD) is trading near $4,778 on the 4-hour chart, right on a rising trendline that has held since late March. Recent candlesticks show small bodies and lower wicks, suggesting buyers are trying to keep prices above this level after several failed attempts to break the $4,890 resistance.
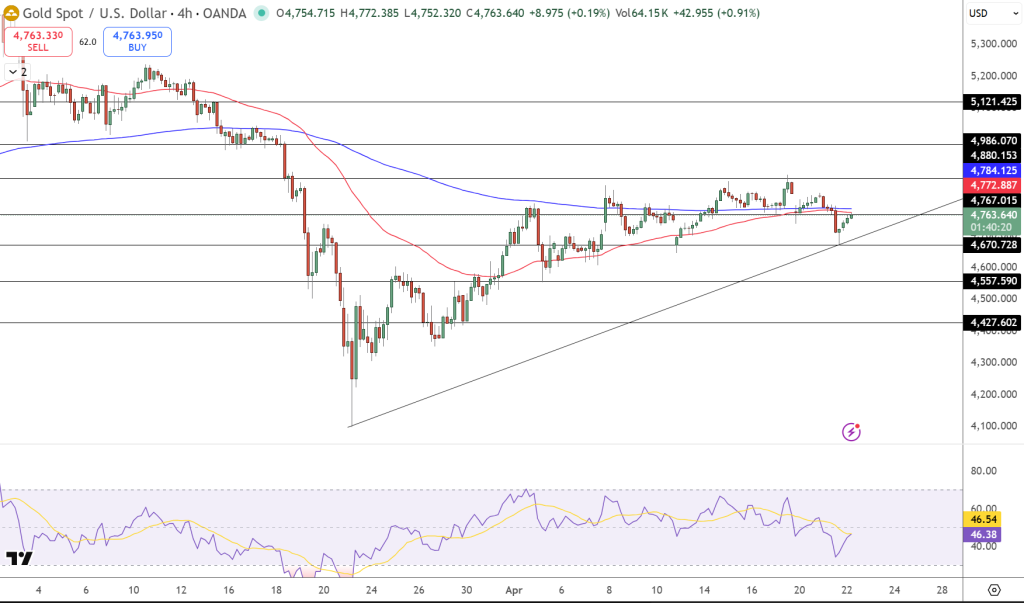
The price is now between two key moving averages. The 50-period moving average near $4,780 is acting as support, while the 200-period moving average around $4,786 is capping gains. This narrow range often leads to a sharp move in price.
Key Levels:
- Resistance: $4,780 → $4,890 → $4,996
- Support: $4,747 → $4,670 → $4,557
Trade Idea: Consider buying above $4,780 with a target of $4,890 and a stop below $4,745.
- Check out our free forex signals
- Follow the top economic events on FX Leaders economic calendar
- Trade better, discover more Forex Trading Strategies
- Open a FREE Trading Account
- Read our latest reviews on: Avatrade, Exness, HFM and XM
Related Articles


Sidebar rates
Related Posts
