Is a Massive Silver Breakout Looming as Supply Deficits Enter Sixth Year?
Silver is consolidating robustly at $75.42, dipping just 0.17%, as the metal tries to find footing in its industrial utility amidst...
Quick overview
- Silver is consolidating at $75.42, showing a slight dip of 0.17% as it seeks stability in a challenging macroeconomic climate.
- The Silver Institute forecasts a persistent global supply deficit through 2026, driven by increasing demand from industries like solar and electric vehicles.
- Recent inflation data has heightened interest in silver as a hedge, despite a stronger dollar, while the gold/silver ratio suggests potential for silver to outperform.
- A bullish technical setup indicates a high probability breakout opportunity, with recommended buy orders above $76.00 targeting $78.22 and $81.00.
Silver is consolidating robustly at $75.42, dipping just 0.17%, as the metal tries to find footing in its industrial utility amidst a tepid macroeconomic environment. A bull flag consolidation in parallel descending channel, building power for a big breakout in the precious metal as its strong bullish fundamentals, driven by real supply and demand, start dominating changing macroeconomic and monetary policy expectations.
What to Watch Today
- Persistent Structural Supply Deficits: The Silver Institute predicts that 2026 will be the sixth straight year of a global supply deficit. While mine supply has been tight for years, demand from key industries like solar photovoltaics, electric vehicles and advanced semiconductors keeps picking up.
- A Sticky Three-Year High Inflation Print: April’s CPI came in hotter than expected, at 3.8% YoY, and sent traders scrambling for more aggressive hawkishness from Fed Chair Kevin Warsh. The resulting dollar strength hasn’t deterred investors from seeing silver as a hard-asset hedge against inflation.
- The Gold/Silver Ratio Looks Extended: As geopolitical safe-haven buying softens with news of an ongoing ceasefire in the US-Iran dispute, the gold/silver ratio is getting historically stretched, and a big mean reversion is expected, which means silver could outperform significantly in a global manufacturing environment.
Silver Technical Picture
The price structure on the two-hour chart appears very clear. Silver has recently put out a bullish hammer candlestick pattern, as price bounced hard off its key dynamic support level at the blue moving average range from $75.43 to $76.35 after a clean retest.
Price has been forming a flag-style consolidation inside a parallel falling channel, with aggressive defense of key higher lows. Meanwhile, a neutral oscillator reading of 47 to 51 has generated positive divergence, suggesting seller exhaustion and ample room for a strong bullish breakout.
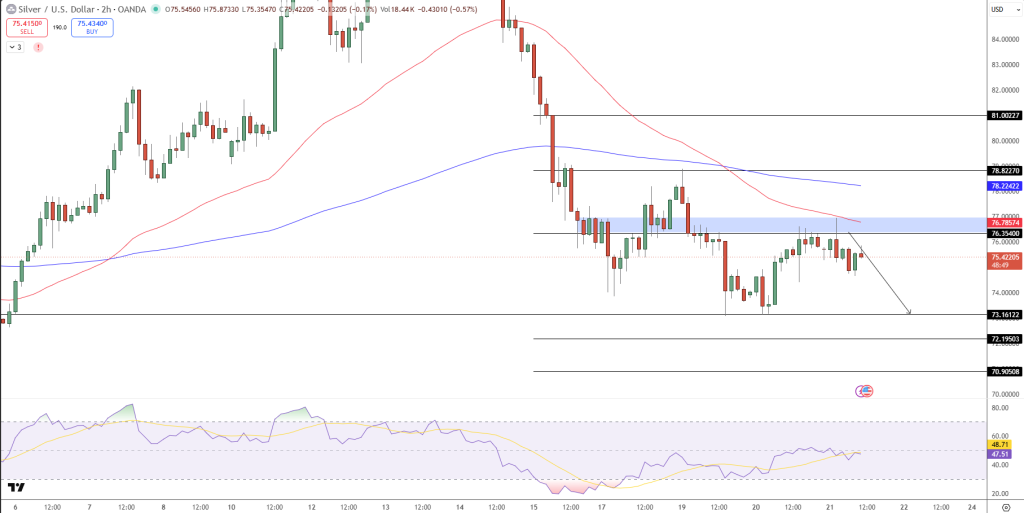
- Resistance: $76.35, $76.78 to $78.22 (MA red ceiling) and $81.00 (swing high)
- Support: $75.43, $73.16 (fib cluster), and $70.90 (big structural level)
Trade Recommendation
We have a very actionable high probability breakout trade setup that’s already triggerable at slightly higher prices.
- Buy Stop Order: above $76.00
- Target 1: $78.22, Target 2: $81.00
- Stop Loss: below recent structural support at $75.30
Takeaway
Silver is making the transformation from a headline-driven safe haven play to a fundamentals-driven industrial market leader. Even though price remains at the mercy of the retail sales release and Fed speakers, there is no way out of a structural supply deficit. For an investor with a longer time horizon looking to play the green energy transition and commodity supply-demand imbalances, the current consolidation is a good accumulation range prior to the next leg up.
- Check out our free forex signals
- Follow the top economic events on FX Leaders economic calendar
- Trade better, discover more Forex Trading Strategies
- Open a FREE Trading Account
- Read our latest reviews on: Avatrade, Exness, HFM and XM
Related Articles

Sidebar rates
Related Posts
