Gold at $4,464 Holds Steady as Ceasefire Holds & Trump-Xi Talks Loom – $4,627 Breakout Next?
As of May 20, 2026, gold (XAU/USD) spot is hovering around $4,464.06 per ounce. The metal is essentially ranging, ticking up slightly...
Quick overview
- As of May 20, 2026, gold is priced at $4,464.06 per ounce, showing a slight increase of 0.04% from the previous day.
- The U.S.-Iran ceasefire is holding, which has reduced some geopolitical tensions affecting gold prices, though the situation remains fragile.
- President Trump's discussions with President Xi have addressed key issues in the U.S.-China conflict, contributing to ongoing uncertainty that supports gold demand.
- Gold's technical analysis indicates bullish potential, with key resistance levels identified between $4,627 and $4,718.
As of May 20, 2026, gold (XAU/USD) spot is hovering around $4,464.06 per ounce. The metal is essentially ranging, ticking up slightly 0.04% from the previous day.
What Matters Today?
Ceasefire Holds for Now: The conditional U.S.-Iran truce, currently six-plus weeks old, is still holding with a little progress reported on oil tanker shipments through the Hormuz Strait. As it stands, that’s lessened some of the geopolitical premium currently priced in to gold, but it remains a tentative deal. China central bank gold buying has continued for 17+ months in a row while other emerging market central banks hold elevated levels of gold buying.
Trump-Xi meetings: President Trump’s meetings with President Xi in Beijing have covered some key topics related to the U.S.-China conflict like trade balance, tech restrictions, rare earth minerals, and Iran. There have been a handful of small wins but much of the uncertainty is still in play which supports gold.
Macro Backdrop: The macro picture is a little messy, markets are digesting mixed U.S. economic data and monetary policy changes with a new Fed Chair, Kevin Warsh.
Gold Technical Analysis
Gold has produced a strong bullish hammer on the 4-hour timeframe after touching on the lower blue channel and confluence of the 0.236 Fib around $4,536. Gold is above the green horizontal support level around $4,510 to $4,464 and the red moving average around $4,596 to $4,627 is resistance.
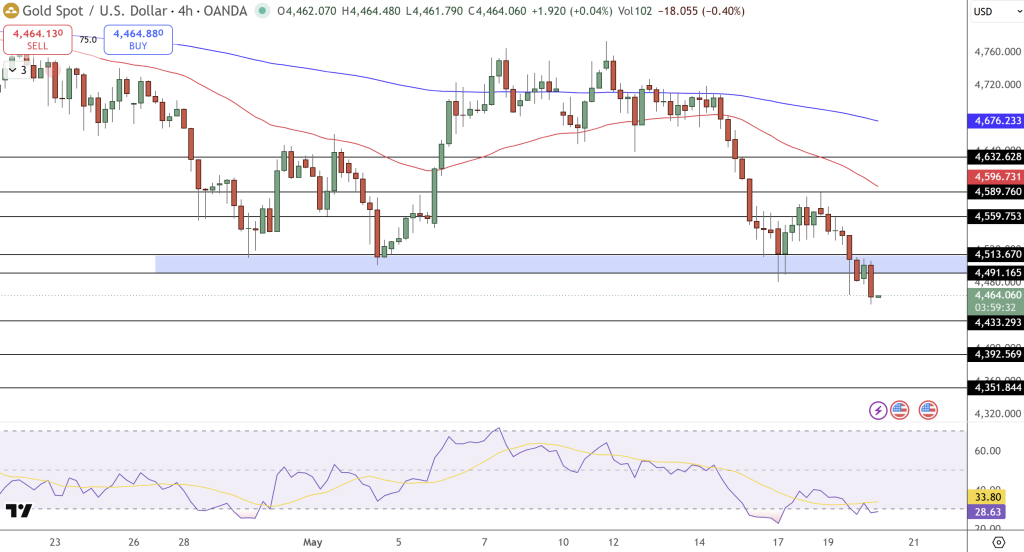
The 4H shows a series of lower highs within a parallel channel from $5,240 tops, but higher lows since the $4,107 low with no triangle breakdown. The most recent bullish push above 0.618 Fib ( $4,627) was followed by an 8-candle consolidation that respected the 0.382 Fib perfectly.
The RSI is deeply oversold around 28 to 33 with bullish divergence on the low, indicating seller weakness and potential for a rebound. Resistance is at $4,571 to $4,627 then $4,667 to $4,718.
Key Levels
Resistance: $4,627 to $4,718 Support: $4,510 to $4,452
Trade Strategy: Bullish above $4,545 with targets $4,627 to $4,718, stop-loss below $4,510. The metal is transitioning from geopolitical-driven buying into macro-driven trading.
The ceasefire agreement has removed near-term upside catalysts, but gold continues to be in demand by major central banks as a reserve currency hedge against rising inflation.
- Check out our free forex signals
- Follow the top economic events on FX Leaders economic calendar
- Trade better, discover more Forex Trading Strategies
- Open a FREE Trading Account
- Read our latest reviews on: Avatrade, Exness, HFM and XM
Related Articles


Sidebar rates
Related Posts
