Can Bullish Hammer Signals Propel WTI Crude Back Past $101?
WTI crude oil (USOIL) is displaying firm technical fortitude, currently trading for $98.84 after rising 0.48%. With energy markets now...
Quick overview
- WTI crude oil is currently trading at $98.84, showing resilience amid a six-week US-Iran ceasefire.
- Transit rates through the Strait of Hormuz are recovering, but full supply rebound is not expected for another quarter.
- The upcoming OPEC+ meeting on June 7 may result in a quota hike of 188,000 bpd for July.
- Geopolitical risks have diminished, leaving supply-demand dynamics to dictate oil prices, with strong US shale oil supply providing stability.
WTI crude oil (USOIL) is displaying firm technical fortitude, currently trading for $98.84 after rising 0.48%. With energy markets now transitioning from crisis-management mode to post-geopolitical stabilization, it is becoming evident that early-spring panic buying has been curtailed by the ongoing six-week US-Iran ceasefire, though structural supply factors keep a firm base under crude.
Today’s Price Drivers
- Recovering Strait of Hormuz Transit Rates: With transit levels through the Strait of Hormuz recovering to 70% to 75% of their pre-conflict levels, a full rebound in supply is not expected for another quarter given damaged infrastructure and elevated shipping insurance rates.
- The Upcoming June 7 OPEC+ Ministerial Meeting: The next ministerial meeting between OPEC+ members will be held June 7, with key members of the cartel poised to announce a 188,000 bpd quota hike for July following recent UAE member exit.
- High Inflation and High Rates: A 3.8% headline CPI print in April will likely require the central bank to continue its restrictive stance under new Chairman Kevin Warsh, limiting the upside growth in demand growth forecasts for the remainder of 2026.
Analysis
The H4 chart presents a highly bullish continuation pattern. WTI crude oil recently printed a very strong bullish hammer, snapping back from the bottom green ascending channel and local trendline support at $97.70 to $98.00. Price is forming a falling wedge structure within the broader macro trend, and has established a series of higher lows since establishing its local trend bottom at $93.87.
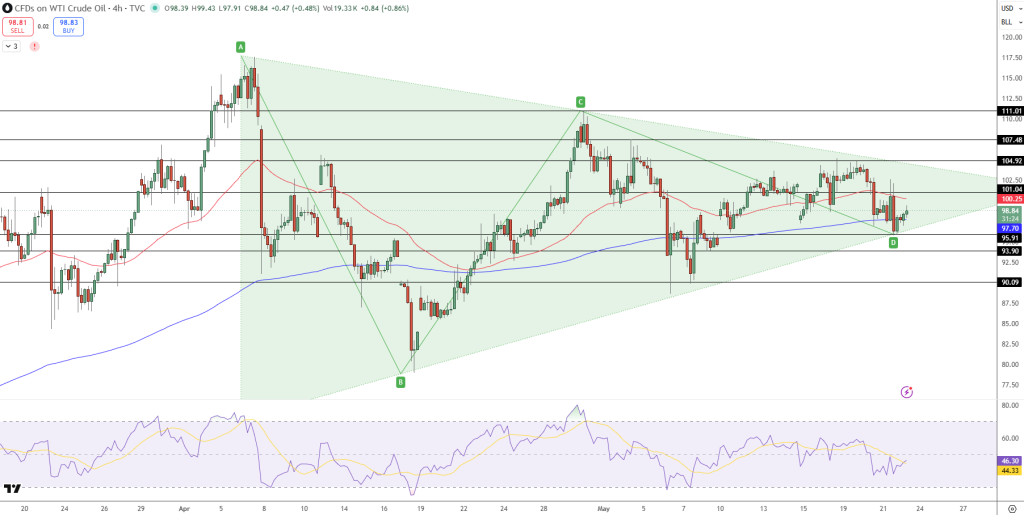
While the red trend moving average line is acting as local dynamic resistance at $100.25 to $101.04, the 44 to 46 neutral oscillator readings coupled with growing positive divergences suggests that the selling side is exhausted.
Resistance: $99.50, $100.25 to $101.04 (Red MA) and $104.59.
Support: $97.70 (Channel bottom), $95.91 (Fibonacci confluence), and $93.87.
Setups
A trend-continuation trade forms as price breaks through the top of the current wedge pattern.
Type: Buy Stop Order Entry: Over $99.50 Targets: T1: $101.04; T2: $104.59. Stop Loss: Under $97.00 (Current trendline invalidated)
Summary
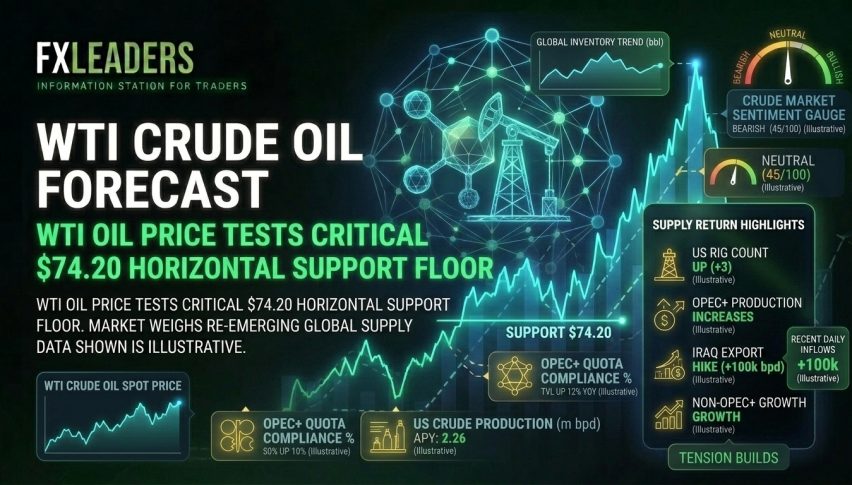
Geopolitical risk has mostly faded for crude oil, leaving the market to trade based on supply-demand forces alone. Global production is strong, and US shale oil supply is ample enough to keep oil prices from collapsing entirely, but lack of major long-term global investment projects means there are few near-term production increases to push prices down.
Next week the market will need to digest EIA inventory figures, so it is worth watching for volatility to develop ahead of the releases as the energy complex digests the upcoming announcement.
- Check out our free forex signals
- Follow the top economic events on FX Leaders economic calendar
- Trade better, discover more Forex Trading Strategies
- Open a FREE Trading Account
- Read our latest reviews on: Avatrade, Exness, HFM and XM
Related Articles


Sidebar rates
Related Posts
