Gold Price Forecast: Will Central Bank Buying Trigger a Breakout Past Key Resistance Levels?
Gold was trading very sideways this weekend at a level near $4,510 with a negligible drop of 0.12%, as the macroeconomic environment...
Quick overview
- Gold is trading sideways around $4,510, reflecting a confusing macroeconomic environment and a slight drop of 0.12%.
- Central bank buying, particularly from the People's Bank of China, is providing a strong support floor for gold prices despite a strong dollar.
- The ongoing ceasefire between the U.S. and Iran has decreased safe haven demand, but the fragile agreement still supports gold prices.
- Traders should prepare for increased volatility as key economic data and Federal Reserve speeches are expected later this week.
Gold was trading very sideways this weekend at a level near $4,510 with a negligible drop of 0.12%, as the macroeconomic environment is rather confusing. The precious metal is nicely consolidating along the lower side of a significant falling wedge. This pattern is reflecting a diminishing geopolitical risk premium, offset by a strong bid for bullion as a result of the ongoing official sector buying from global central bankers.
Today’s key factors are:
- Inflation data from April came in hotter than expected and is still driving markets to adjust lower. The persistent rise in prices has led traders to reduce their expectations for rate cuts, especially in the immediate term. This has resulted in a rise in real yields, under the direction of Kevin Warsh.
- Central bank buying has been and will remain the floor for bullion. The People’s Bank of China has now purchased gold for at least 17 months in a row. This trend has helped prevent a large move lower for precious metal despite the strength in the dollar.
- The ceasefire between the U.S. and Iran is ongoing past six weeks and there seems to be a steady flow of oil shipments through the Strait of Hormuz. This has decreased safe haven demand somewhat, but the agreement is fragile enough that it has provided underlying strength to the precious metal.
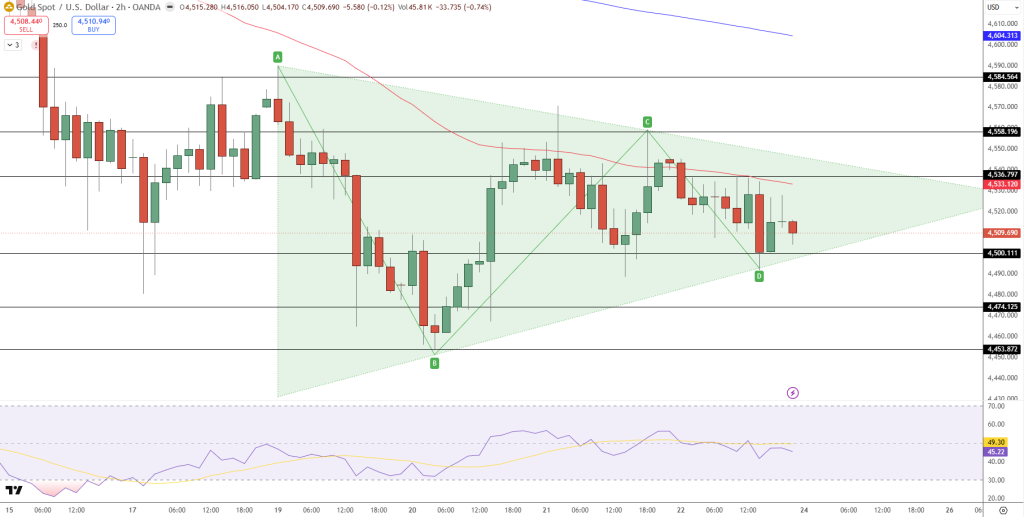
In terms of price, gold appears to have found strong support at a major falling wedge’s lower side and the black descending trendline on the two-hour timeframe between $4,500 and $4,509. The red moving average will serve as a ceiling and dynamic resistance around the area of $4,533 to $4,536. The 0.5 Fibonacci retracement, however, is above this area at $4,512 and price action is coiling tightly below it. The uptrend remains well intact. The momentum oscillator is now completely within the middle range (45-51) and has begun to print a positive divergence, confirming the trend reversal in the short-term.
The key price levels are as follows:
- Resistance: $4,520, $4,533 to $4,546 (the red MA ceiling), $4,571 (the key weekly target)
- Support: $4,509 (wedge floor), $4,500 (key psychological level), $4,480 (structural support)
Entry Level:
As price action coiled tightly at the red MA ceiling, there is a clear opportunity to enter a long position at the current price.
- Buy stop: above $4,520
- Targets: $4,546 (Target 1), $4,571 (Target 2)
- Stop Loss: below $4,498 (the structural support level)
Our latest gold price forecast is highlighting a crucial consolidation phase as a prelude to an explosive price move on the upside. Fading headline risks in the Middle East have reduced near-term demand for safe haven assets. The long-term bullish thesis remains intact, however, as debt expansion is global and countries around the world continue to de-dollarize.
Traders should expect increased market volatility as the retail sales release comes later this week and a slate of Federal Reserve speakers take the podium. We continue to recommend accumulation into the wedge floor with a view towards a significant expansion higher.
- Check out our free forex signals
- Follow the top economic events on FX Leaders economic calendar
- Trade better, discover more Forex Trading Strategies
- Open a FREE Trading Account
- Read our latest reviews on: Avatrade, Exness, HFM and XM
Related Articles


Sidebar rates
Related Posts
