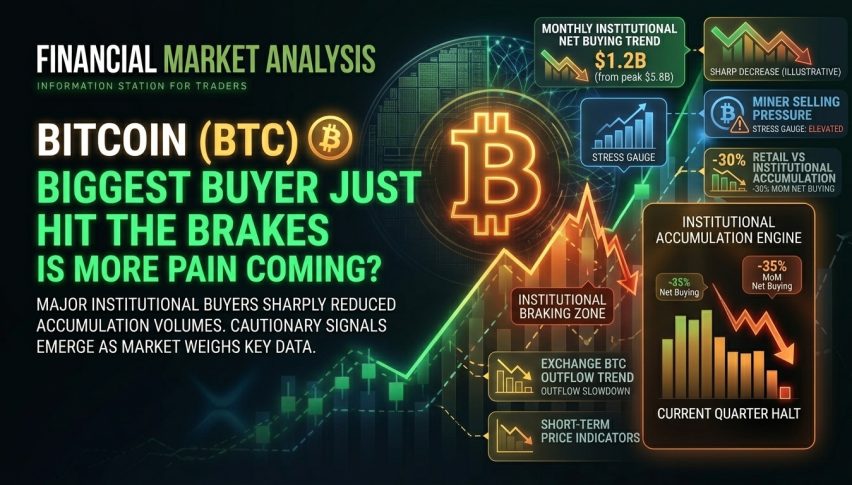
Bitcoin’s Biggest Buyer Just Hit the Brakes: Is More Pain Coming?
The United States was a key driving force in Bitcoin’s latest market upswing, yet that momentum has waned considerably...
Quick overview
- American demand for Bitcoin has significantly declined, as indicated by the falling U.S. to Rest-of-World Bitcoin Reserve Ratio.
- Spot Bitcoin ETFs experienced record net outflows of approximately $4.5 billion in June 2026, primarily driven by major players like BlackRock.
- Bitcoin's price is currently testing key support levels around $58,000, with potential for further downside if it remains below $60,000.
- Investors should monitor the interplay of U.S. demand, ETF flows, and Bitcoin's price action for insights into future market trends.
The United States was a key driving force in Bitcoin’s latest market upswing, yet that momentum has waned considerably. Spot Bitcoin ETFs logged their largest ever outflows in June, and a range of on-chain and flow data confirms a marked dip in American interest. Traders are now pondering whether we will see further downside ahead.
American Bitcoin Demand Subsides
One telling data point is the U.S. to Rest-of-World Bitcoin Reserve Ratio: the proportion of all Bitcoin reserves held by U.S. entities, such as institutions and ETFs, corporations, and the government, against the rest of the world. During most of the most recent cycle, the ratio was rising consistently, topping out near the 1.79 level, but has since been declining. (Recent numbers are in the range of 1.59 to 1.65.)
As you may know, U.S. demand has been an important pillar in the recent run of price gains. Historically, U.S. demand has declined either ahead of or in sync with weakness in the price. This is one way the ratio has fallen prior to the most recent price dip, so it is a signal of declining American demand leading into the drop. Without a rebound in the United States, Bitcoin’s upside is likely capped.
ETF Outflows Hit Record Highs
The flow of spot Bitcoin ETFs are the most clear window into what the institutions are doing. And they have been in heavy negative territory for the past month.
Net outflows in June 2026 were a record roughly $4.5 billion (the biggest net outflows month since 2024), beating the all-time ETF outflows record. This was mostly driven by BlackRock’s IBIT, which saw net outflows of ~$3.55 billion in June.
Prior ETF flows into spot Bitcoin ETFs played a crucial role as a buyer when prices dipped throughout the past couple of years, and this massive outflow has eroded that support. However, despite the record outflow month, ETF inflows are still positive overall with approximately $51 billion in total ETFs net inflows (though ETFs’ total AUM has dropped significantly from its all-time highs in early 2026, indicating investors rotated out of crypto and into fiat and/or other assets in the face of macroeconomic headwinds).
Bitcoin’s Price Testing Important Support
Bitcoin’s price has been reflecting these developments as well. The asset has broken below $60,000 and is hovering around $58,000 to $58,800. Bitcoin’s intraday lows in late June/early July 2026 were around $57,700 to $58,000, and $58k is one of the lowest prices Bitcoin has seen in recent months. Price action now tests Bitcoin’s major supports at key levels.
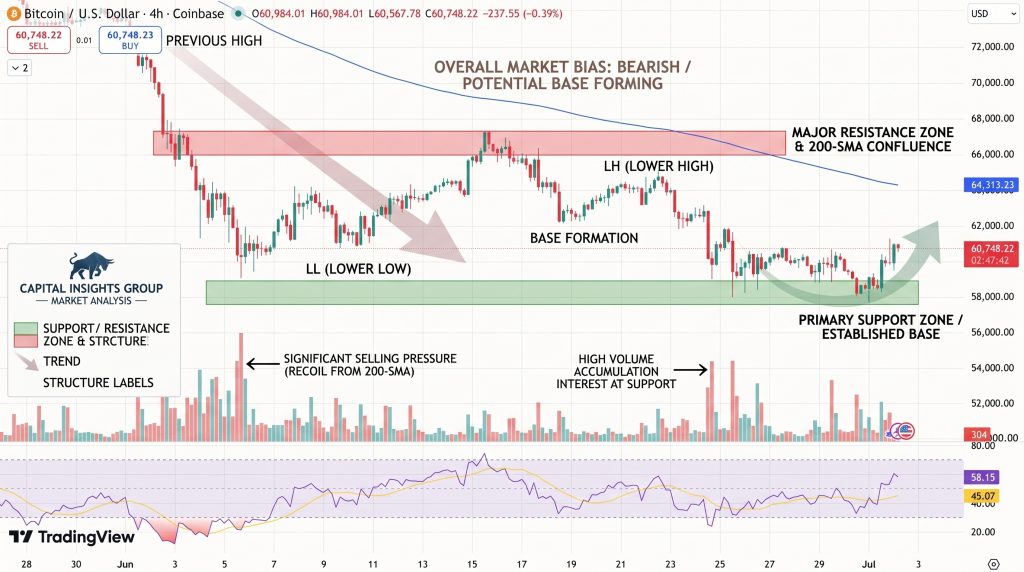
Bitcoin’s Relative Strength Index (RSI) indicator is now in or approaching the oversold territory, which can indicate extreme bearish pressure and a subsequent short-term price rebound, but momentum hasn’t shifted back in Bitcoin’s favor. If the price stays below the $60,000 to $62,000 level, we could see further downside.
Three major numbers to note (early July 2026):
- U.S. reserve ratio is significantly down from peaks of ~1.79 in this recent cycle as American relative demand has faded.
- ETF inflows/outflows saw June as an all-time record ~$4.5 billion net outflows month, mostly driven by major players like BlackRock.
- Bitcoin price is near $58,000 to $59,000 (well below the $60,000 mark) with strong downward selling pressure.
Investors should watch these three data points closely in combination, as fading U.S. demand, massive institutional ETF outflows, and price action in the $57k to $58k range are all pointing to a more neutral or cautious Bitcoin outlook for the near term. The broader liquidity macro environment, risk appetite, etc. will be important to know if this correction continues and becomes a deeper downtrend. (As always, check real-time ETF flows from SoSoValue, on-chain metrics from Farside Investors, and other data sources for the latest data.)
- Check out our free forex signals
- Follow the top economic events on FX Leaders economic calendar
- Trade better, discover more Forex Trading Strategies
- Open a FREE Trading Account
- Read our latest reviews on: Avatrade, Exness, HFM and XM
Related Articles
Sidebar rates
Related Posts
Ava

