Prices Forecast: Technical Analysis
For today, THORChain is predicted to close at approximately $0.4150, with a range between $0.4100 and $0.4200. Looking ahead to the week, the expected closing price is around $0.4200, with a potential range of $0.4100 to $0.4300. The technical indicators suggest a cautious outlook, as the RSI is currently at 48.54, indicating a neutral trend, while the ATR of 0.0168 suggests low volatility. The price has been oscillating around the pivot point of $0.41, which is a critical level for determining the next direction. If the price holds above this pivot, it could signal a bullish sentiment, while a drop below may indicate bearish pressure. The recent price action shows a slight recovery from lower levels, but the overall trend remains uncertain. The market’s reaction to these levels will be crucial in determining the short-term direction of THORChain.
Fundamental Overview and Analysis
THORChain has experienced significant fluctuations in its price, recently trading around $0.4133. The asset’s value is influenced by various factors, including market demand, technological developments, and investor sentiment. Recent trends indicate a growing interest in decentralized finance (DeFi) platforms, which could positively impact THORChain’s adoption and usage. However, competition from other DeFi projects poses a challenge, as does the overall volatility in the cryptocurrency market. Investors are currently cautious, with mixed sentiments reflected in trading volumes. The asset appears to be fairly valued at its current price, but potential growth opportunities exist if it can expand its user base and enhance its technological offerings. Regulatory developments could also play a significant role in shaping the future of THORChain, either positively or negatively.
Outlook for THORChain
The future outlook for THORChain remains cautiously optimistic, with potential for growth in the DeFi sector. Current market trends suggest that if THORChain can maintain its position above the pivot point, it may attract more bullish sentiment. In the short term (1 to 6 months), prices could range from $0.4100 to $0.4500, depending on market conditions and investor interest. Long-term forecasts (1 to 5 years) suggest that if THORChain successfully scales its platform and navigates regulatory challenges, it could see significant price appreciation. However, external factors such as market crashes or geopolitical events could adversely affect its price. Overall, the asset’s performance will largely depend on its ability to innovate and adapt to the rapidly changing cryptocurrency landscape.
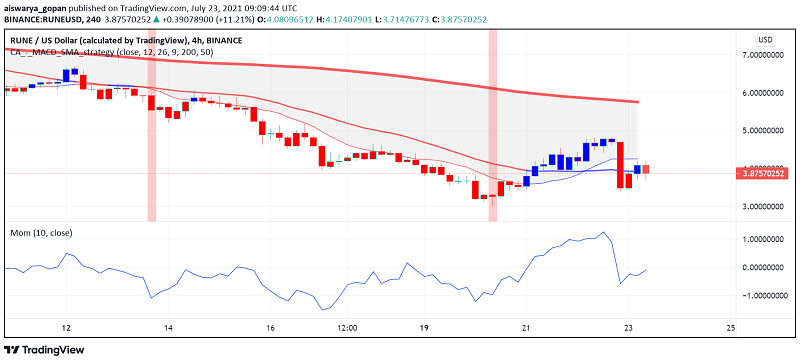
Technical Analysis
Current Price Overview: The current price of THORChain is $0.4133, which is slightly lower than the previous close of $0.4133. Over the last 24 hours, the price has shown slight volatility, trading within a narrow range. Support and Resistance Levels: Key support levels are at $0.40, $0.39, and $0.38, while resistance levels are at $0.42, $0.43, and $0.44. The pivot point is $0.41, and the asset is currently trading just above this level, indicating a potential bullish outlook. Technical Indicators Analysis: The RSI at 48.54 suggests a neutral trend, while the ATR of 0.0168 indicates low volatility. The ADX is at 16.96, suggesting a weak trend. The 50-day SMA is at $0.4137, and the 200-day EMA is at $0.4840, indicating no crossover yet. Market Sentiment & Outlook: Sentiment appears neutral, with price action hovering around the pivot point, and the RSI indicating no strong momentum in either direction.
Forecasting Returns: $1,000 Across Market Conditions
The table below outlines potential investment scenarios for THORChain, providing insights into expected price changes and estimated returns on a $1,000 investment.
| Scenario | Price Change | Value After 1 Month |
|---|---|---|
| Bullish Breakout | +10% to ~$0.4543 | ~$1,100 |
| Sideways Range | 0% to ~$0.4133 | ~$1,000 |
| Bearish Dip | -10% to ~$0.3710 | ~$900 |
FAQs
What are the predicted price forecasts for the asset?
The daily price forecast for THORChain is approximately $0.4150, with a range of $0.4100 to $0.4200. For the weekly forecast, the expected closing price is around $0.4200, ranging from $0.4100 to $0.4300.
What are the key support and resistance levels for the asset?
Key support levels for THORChain are at $0.40, $0.39, and $0.38. Resistance levels are identified at $0.42, $0.43, and $0.44, with a pivot point at $0.41.
What are the main factors influencing the asset’s price?
The asset’s price is influenced by market demand, technological advancements, and investor sentiment. Additionally, competition from other DeFi projects and regulatory developments play significant roles.
What is the outlook for the asset in the next 1 to 6 months?
In the short term, THORChain’s price could range from $0.4100 to $0.4500, depending on market conditions. The outlook remains cautiously optimistic, with potential for growth in the DeFi sector.
What are the risks and challenges facing the asset?
THORChain faces risks such as market volatility, competition from other projects, and regulatory hurdles. These factors could impact its price and overall market performance.
Disclaimer
In conclusion, while the analysis provides a structured outlook on the asset’s potential price movements, it is essential to remember that financial markets are inherently unpredictable. Conducting thorough research and staying informed about market trends and economic indicators is crucial for making informed investment decisions.