A Crucial Level for Bullish Gold – Time To Sell?
Considering the consistent hike in safe haven appeal, I decided to enter a sell position at $1275. Later it proved to be the right decision. The gold is placing a multi-week high now at $1279. Curious about its next moves? Let's find out!
Daily Timeframe – Technical View
Uncertainty caused by North Korea and the U.S. is threatening investors. Due to this uncertainty, gold prices are soaring. But now, the gold technicals are starting to intervene.
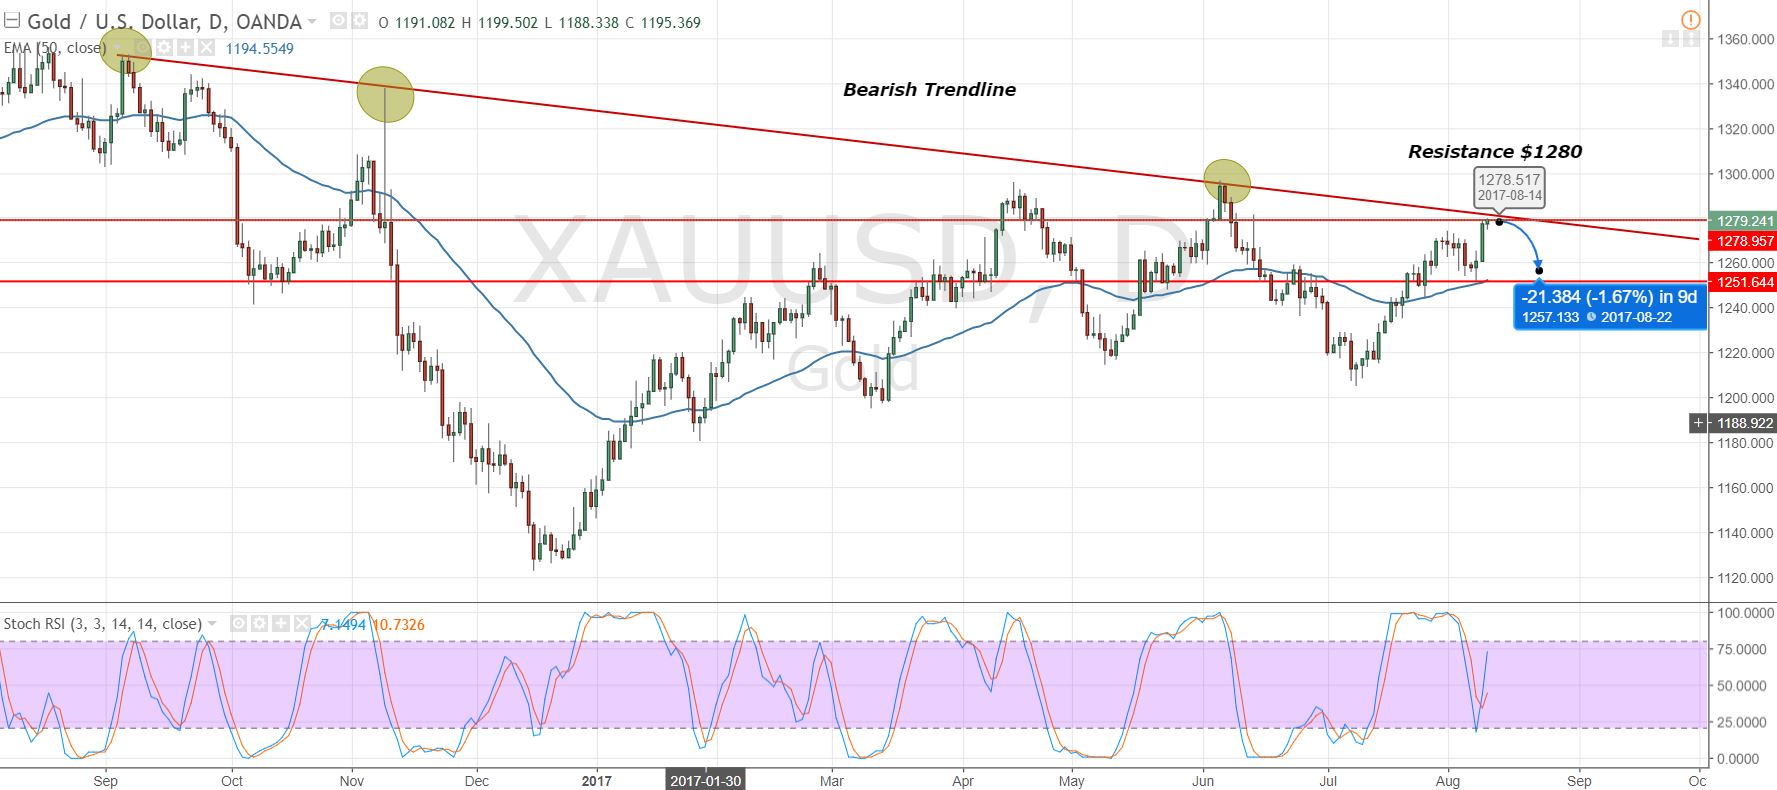
 Gold – Daily Timeframe – Bearish Trendline Pattern
In the daily chart, Gold is facing a long term trendline resistance at $1281. A break above this level can open further room for buying until $1296. The stochastic is directing upward and it's valued at 46, signifying there is still further room for bulls. However, the lower time frame tells a different story.
2-Hour Timeframe – Technical View
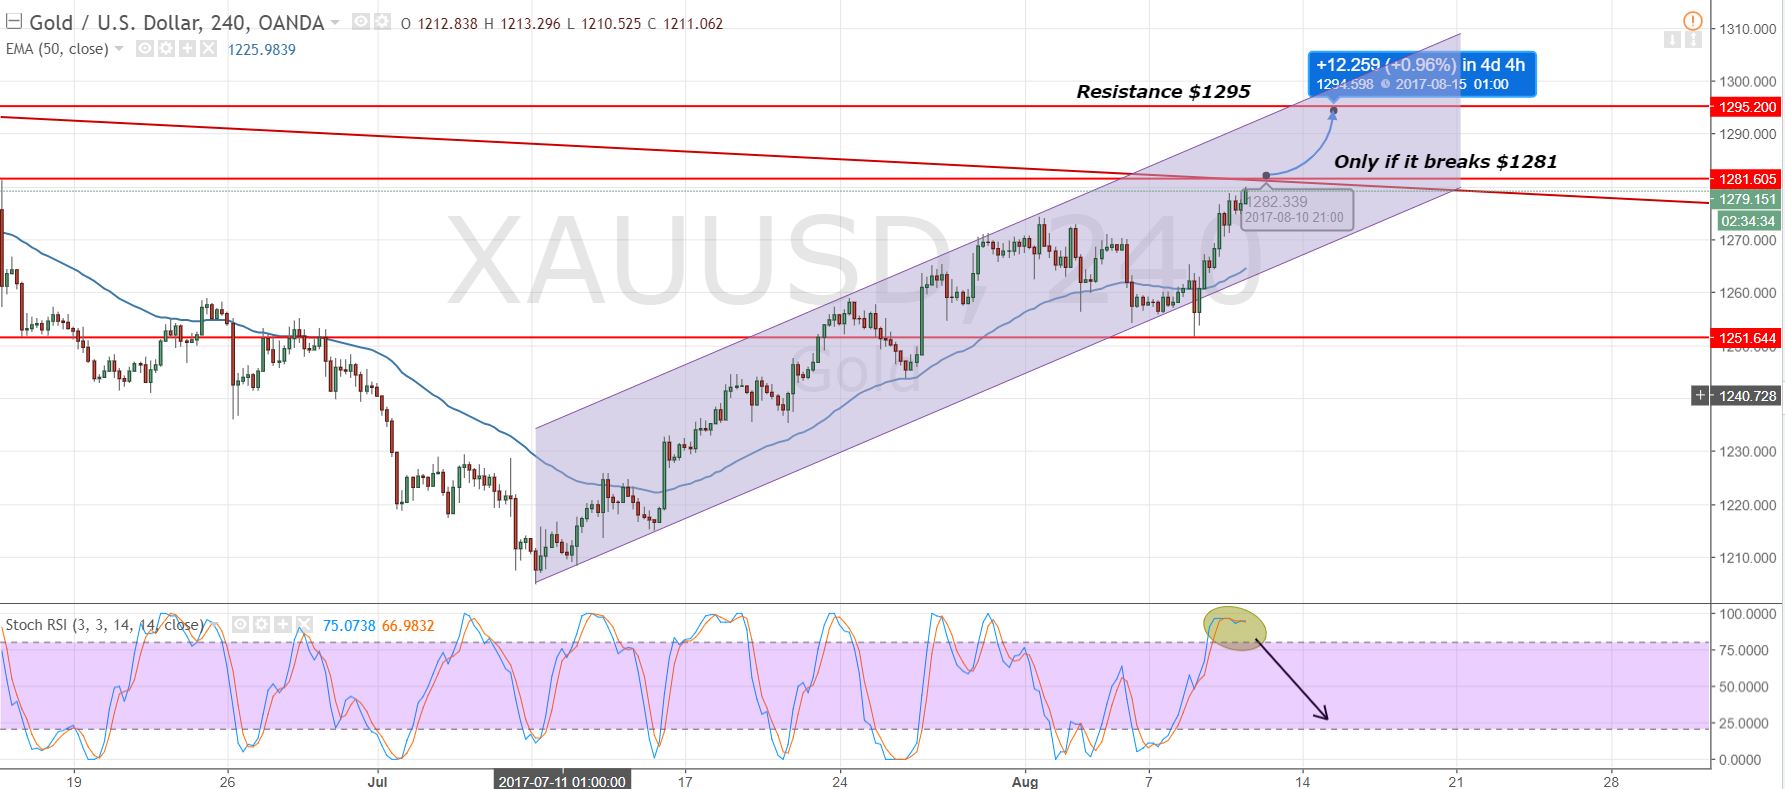
Zooming out to the 2-hour chart, the resistance at $1281 is still there. However, the stochastic is significantly overbought at 94. This shows that the bulls are getting exhausted and they could initiate the profit takings soon.
 Gold – 2-Hour Chart View
Additionally, the prices are too far from the 50-periods EMA, demonstrating that technically the price of gold should be somewhere around $1265. Anyways, if both economies keep spreading war sentiments we will see gold at $1295 upon the breakage of $1282.
Gold Trading Plan
I think it's worthwhile to enter a sell position at $1280 to target $1271 with a stop loss above $1285. Good luck and follow money management techniques to stay safe in this volatile market.


 Gold – Daily Timeframe – Bearish Trendline Pattern
 Gold – 2-Hour Chart View


