Gold Awaits Breakout – This Time It’s an Ascending Triangle
Despite the volatile session, the gold prices are stuck in a narrowly mixed range of $1,289 - $1,295. For today, I'm seeing a really cool...
Despite the volatile session, the gold prices are stuck in a narrowly mixed range of $1,289 – $1,295. The Fed’s dovish FOMC meeting minutes signaled an interest rate hike at the June meeting which has already been priced into the market. The statement became bearish after Federal Reserve hinted it will let inflation run over their 2% goal for a “temporary period”.
Logically, it means they will be fine with higher inflation and will be okay to keep the policy dovish. Consequently, the dollar is trading in a bearish tone. For today, I’m seeing a really cool trade setup in gold. Check this out…
Gold’s Technical Analysis – Triangle Pattern
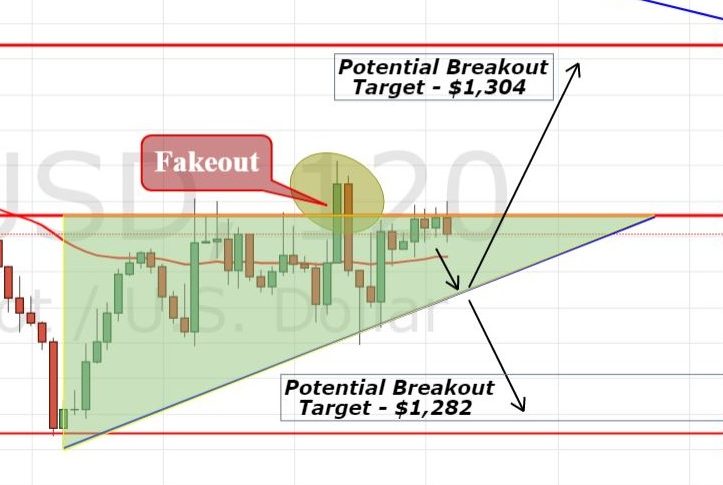
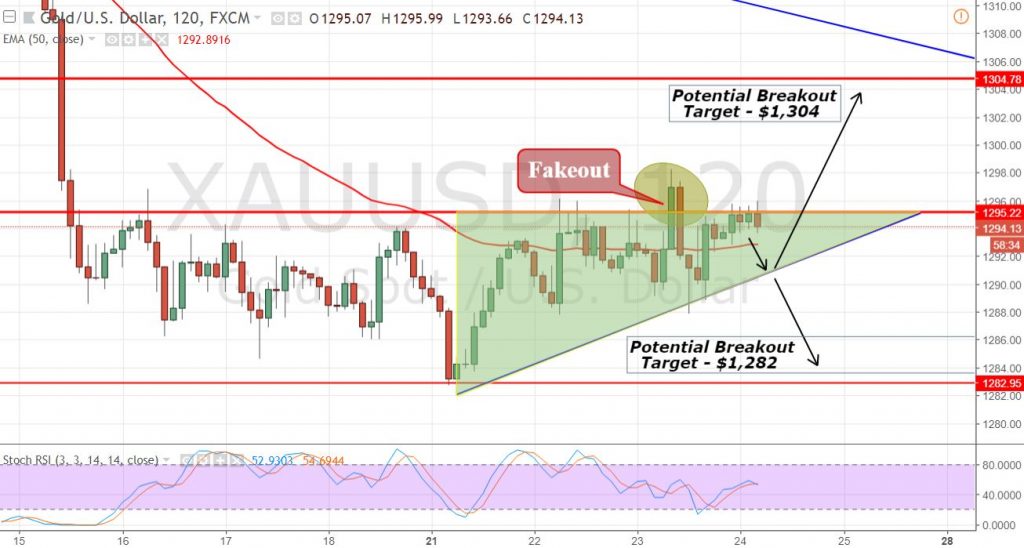
On the 2-hour chart, gold is testing $1,295 probably for the sixth time now. On Wednesday, the precious metal soared above $1,295 to place a high of $1,298 but it proved to be a fakeout.
Gold – 2 Hour Chart
For the moment, the yellow metal is holding below a solid resistance level of $1,295 which is extended by an ascending triangle pattern. These patterns typically break upward. Thus, the upward violation of this level can open further room for buying until $1,304. Whereas, the support prevails at $1,290.
Support Resistance
1289.2 1297.14
1286.74 1299.6
1282.77 1303.57
Key Trading Level: 1293.17
Gold – XAU/USD – Trading Idea
It will be nice to stay bullish above $1,293 with a stop below $1,289 and a take profit of $1,299 and $1,304. Good luck!
- Check out our free forex signals
- Follow the top economic events on FX Leaders economic calendar
- Trade better, discover more Forex Trading Strategies
- Open a FREE Trading Account
- Read our latest reviews on: Avatrade, Exness, HFM and XM
Related Articles


Sidebar rates
Related Posts
