2 Moving Averages on 2 Different Time-Frames for Litecoin
Litecoin has had a bad month in May. It lost %70 from top to bottom but now it has reached a couple of MAs and it seems like it will reverse
Litecoin has had a bad month in May. It climbed climbed $35 in the first week, but it reversed down and lost $70 from top to bottom. Although, that has been the story with all cryptocurrencies. They have been on a bearish trend throughout May and the most discouraging thing for buyers has been the fact that the bounces have been very minimal.
The fundamentals have been against cryptocurrencies because different governments are cracking down on dodgy cryptos. But, there are a few technical things that indicate a possible trend reversal for Litecoin and other major cryptos.
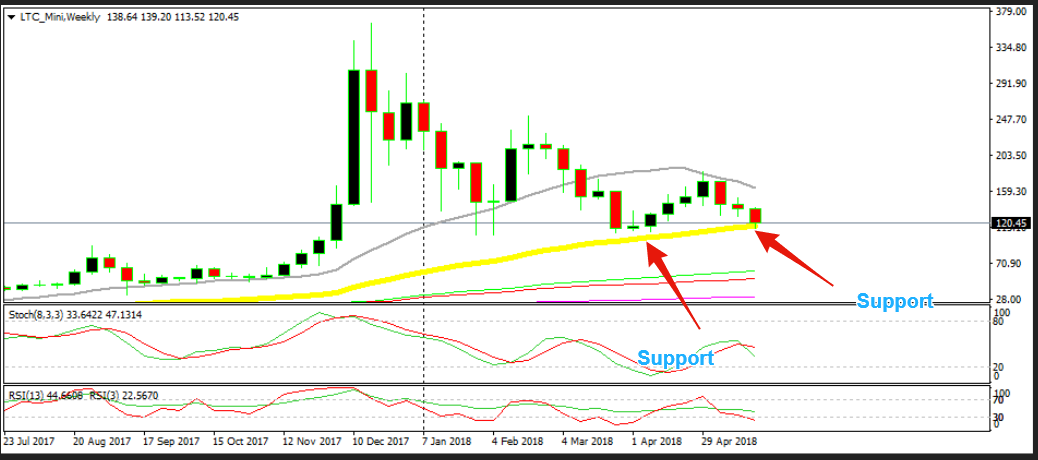
The first thing is that Litecoin sellers haven’t been able to make new lows. The lows price this year was $105.45 back in February during the major pullback, according to my cryptocurrency broker. The second low was at 108.50 at the end of March. This time, the low was 113.50 on Thursday this week. So, higher lows is a bullish reversal sign.
That becomes even stronger when the price finds support at a a moving average where it has found support and eventually reversed before. This is the 50 SMA (yellow) which you can see from the chart above. This moving average provided support and reversed the bearish trend in March and it seems like it is providing support once again now. The 50 SMA comes at 117, so it was pierced once this week. But the price has pulled back above it and looks like the weekly candlestick will close above it. If it does, then that would be a bullish reversing signal for next week.
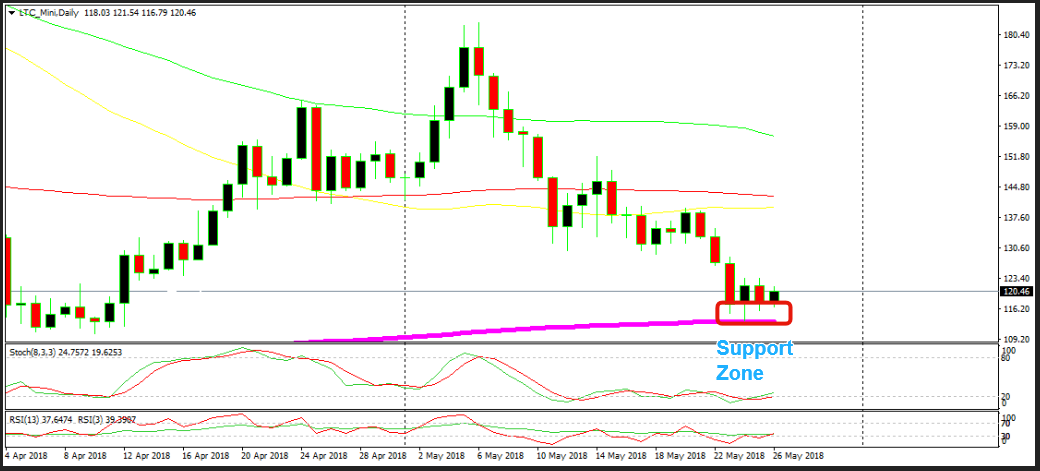
That is one moving average on the daily chart, the next one is one daily time frame chart. This one is the 200 SMA (purple) on the daily chart and it comes at $113.50. That is exactly at the low back on Thursday, so this moving average has provided support exactly to the pip.
This makes it three technical indicators pointing up. The higher highs, the 50 SMA on the weekly chart and the 200 SMA on the daily chart. Will Litecoin reverse back up? Well, it depends whether the sentiment changes in the crypto market because this market moves altogether now. The technical picture is almost identical in Bitcoin and Ethereum as well, so probably we will see a reverse next week.
- Check out our free forex signals
- Follow the top economic events on FX Leaders economic calendar
- Trade better, discover more Forex Trading Strategies
- Open a FREE Trading Account
- Read our latest reviews on: Avatrade, Exness, HFM and XM
Related Articles


Sidebar rates
Related Posts
