Cashing in on EUR/USD
EUR/USD retraced higher during the Asian session, but it reverse again below 1.14 so the downtrend remains intact.
We opened a sell forex signal in EUR/USD a while ago. This pair lost nearly 200 pips yesterday as the USD bulls came back after the holidays. The bearish move continued in the early hours of the Asian session after the AUD crashed lower, while the JPY surged 4 cents higher.
But, it made a bullish reversal as the Asian session got underway and fears regarding the Chinese economy eased once again. USD/JPY retraced higher and so did EUR/USD. So, we decided to go short on EUR/USD since the retrace higher seemed complete.
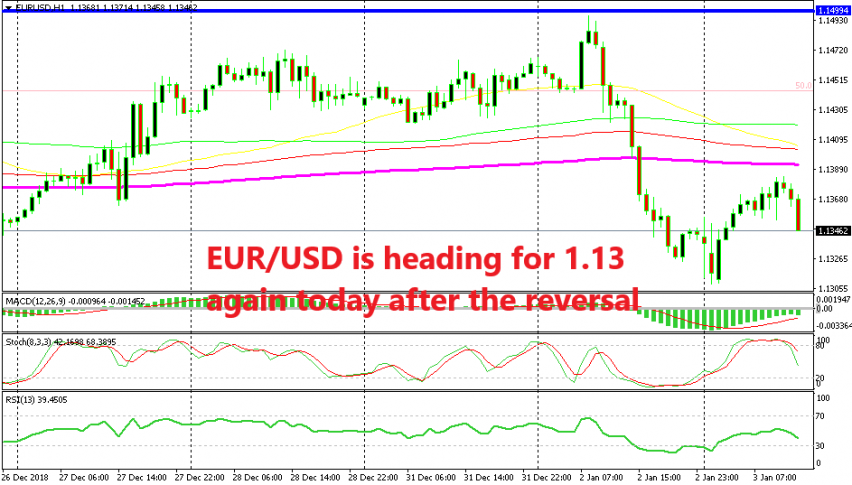
As you can see on the H1 chart above, the stochastic indicator became overbought which meant that the retrace was complete technically on this time-frame. EUR/USD formed a spinning top candlestick which is a reversing signal and the 200 SMA (purple) was standing just above the price, waiting to provide resistance if the buyers had any funny ideas to push higher.
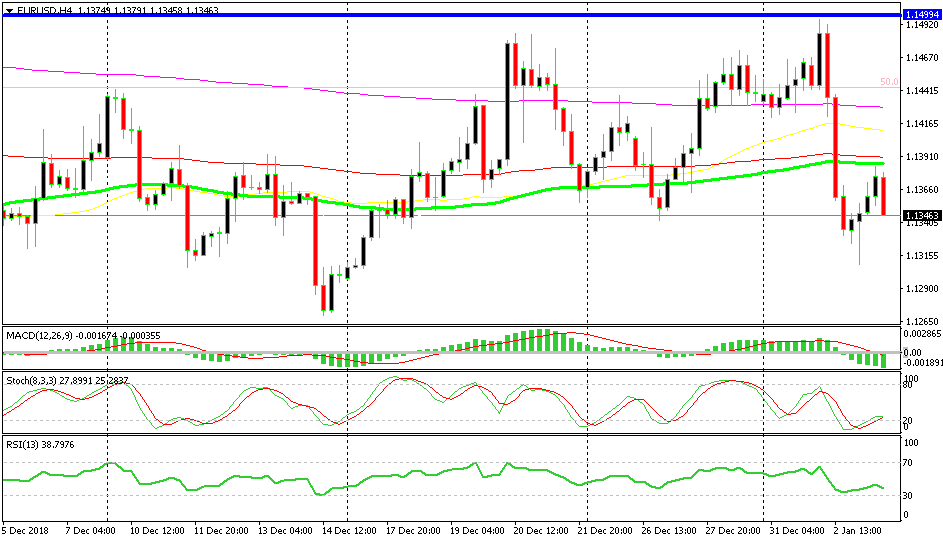
The price reversed at the 100 SMA on the H4 chart
But, they didn’t and EUR/USD reversed pretty quickly from 1.1380s. Switching to the H4 chart, we see that the price reversed at the 100 simple MA (green). The 100 smooth MA (red) was standing closely above it, so they would provide some strong resistance if the bullish momentum continued.
But, I suppose the other traders saw these chart setups and decided to reverse the trade, which was good for us. Our signal reached the take profit target and we got our pips from that trade.
- Check out our free forex signals
- Follow the top economic events on FX Leaders economic calendar
- Trade better, discover more Forex Trading Strategies
- Open a FREE Trading Account
- Read our latest reviews on: Avatrade, Exness, HFM and XM
Related Articles

Sidebar rates
Related Posts
