Bitcoin in Crossroads at $6,000
Bitcoin has reversed on the monthly chart and is pointing up, but the weekly chart is pointing to a pullback lower
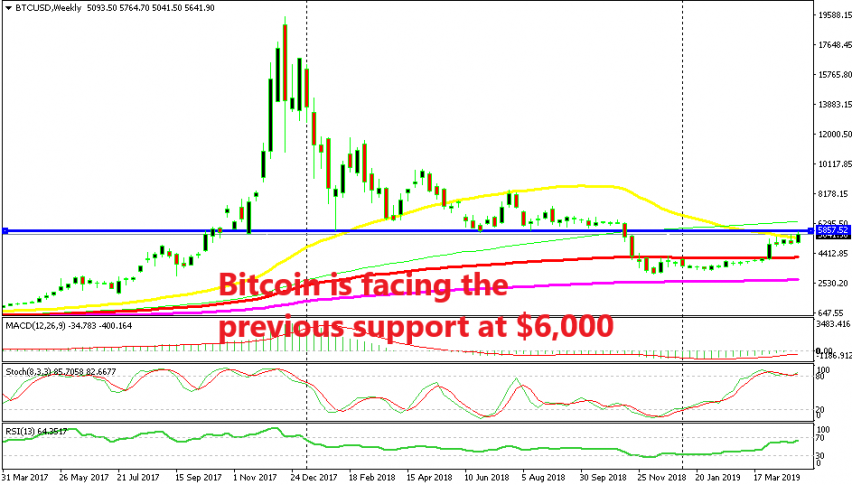
Cryptocurrencies made a reversal at the end of last year after trending down on a major bearish trend during 2018. BITCOIN led the way during this reversal. It found resistance around the $4,000 level which formed a resistance zone for some time. But, that level was eventually broken last month and the price surged to $5,000. This round level didn’t offer much resistance but it didn’t offer much support on the way down either, so it was broken quite easily.
The price traded above and below the $5,000 level for some time and the 50 SMA provided resistance on the weekly chart for a few weeks, as you can see above. The price formed a couple of upside-down hammers which pointed to a bearish reversal, but the market had made up its mind to remain bullish. That became clear when the sellers couldn’t push lower after the hammer candlesticks.
If something can’t go down, it will eventually go up, and the bullish move finally came this week. Although, the week is not over yet for cryptocurrencies since this market remains open during the weekend. If this week’s candlestick pulls back lower and closes near the opening price, then it will be a strong signal that we might see a reversal. After all, the target for buyers is reached if they have targeted the $6,000 level. The area around this level provided solid support for most of last year as you can see from the weekly chart. So, we should at least see a decent pullback from here, if not a reversal.
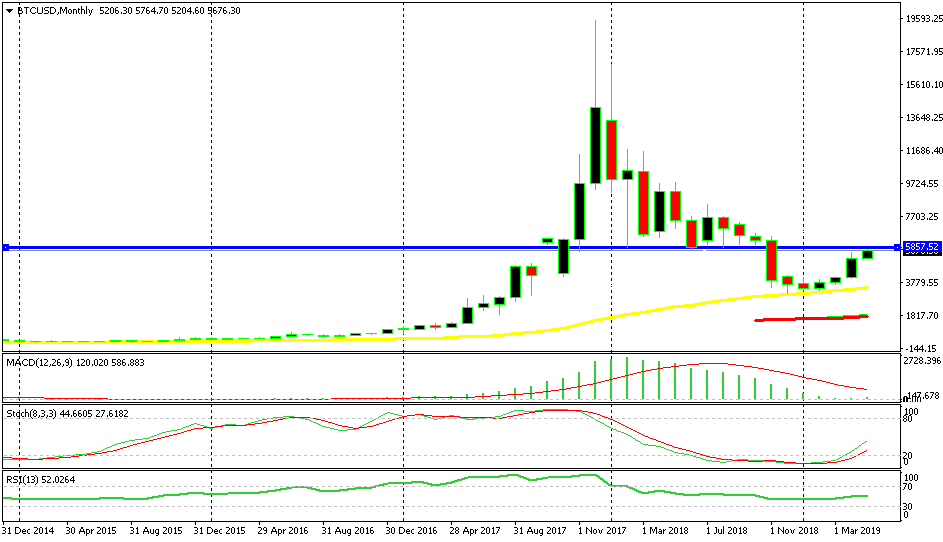
The price reversed after reaching the 50 SMA on the monthly chart
But the monthly chart paints a different picture. In this time-frame, the 50 SMA (yellow) provided support during the last months of last year and early this year. The price bounced off the 50 SMA, so it was confirmed as a support indicator, after having provided support for a few years before the surge in 2018. So it seems that in this time-frame the target for the sellers was the 50 SMA and now the trend should shift to bullish. The price has bounced and the value has almost doubled since bottoming out above $3,000.
So now we have two contradicting signals in two different time-frame charts. The weekly chart is pointing to a bearish reversal, while the monthly chart is still pointing up. But, the area around $6,000 is a big level which should at least provide some sort of resistance. So, I am hoping for a pullback at least if not a proper reversal.
- Check out our free forex signals
- Follow the top economic events on FX Leaders economic calendar
- Trade better, discover more Forex Trading Strategies
- Open a FREE Trading Account
- Read our latest reviews on: Avatrade, Exness, HFM and XM
Related Articles


Sidebar rates
Related Posts
