The 50 SMA Turns From Support to Resistance for Gold
Gold moved higher last week, but it reversed back down below the 50 SMA which seems to have turned into resistance now
GOLD turned really bullish during summer, as it became evidently clear that the global economy was going to weaken further instead of improving. The trade war was also escalating, which hurt the market sentiment and, as a result, safe havens surged higher and Gold gained around $270.
But, the sentiment improved in the last couple of months and the partial trade deal has a good part in that. Gold retreated lower in September making lower lows and lower highs, although in October Gold has traded mostly sideways, which shows that uncertainty still prevails among Gold traders.
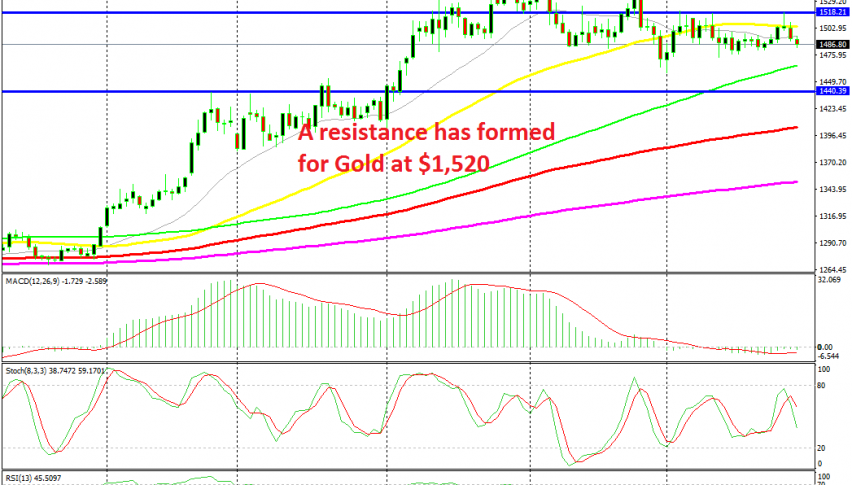
Gold slipped below the 50 SMA on the daily chart this month and despite many efforts to get it back above it again, all daily candlesticks have closed below it. On Friday last week, Gold buyers pushed the price above the 50 SMA once again, but the price retreated lower and closed below the 50 SMA.
That daily candlestick closed as an upside-down pin, which is a reversing signal and Gold reversed lower this week. Now the price should head for the 100 SMA (green) and then to the previous support at $1,456. But, one step at a time, let’s see if sellers remain in control.
- Check out our free forex signals
- Follow the top economic events on FX Leaders economic calendar
- Trade better, discover more Forex Trading Strategies
- Open a FREE Trading Account
- Read our latest reviews on: Avatrade, Exness, HFM and XM
Related Articles


Sidebar rates
Related Posts
