Gold Bounces Off the 200 SMA Once Again
Gold bounced off the 200 SMA today, but has stopped at the 100 SMA now
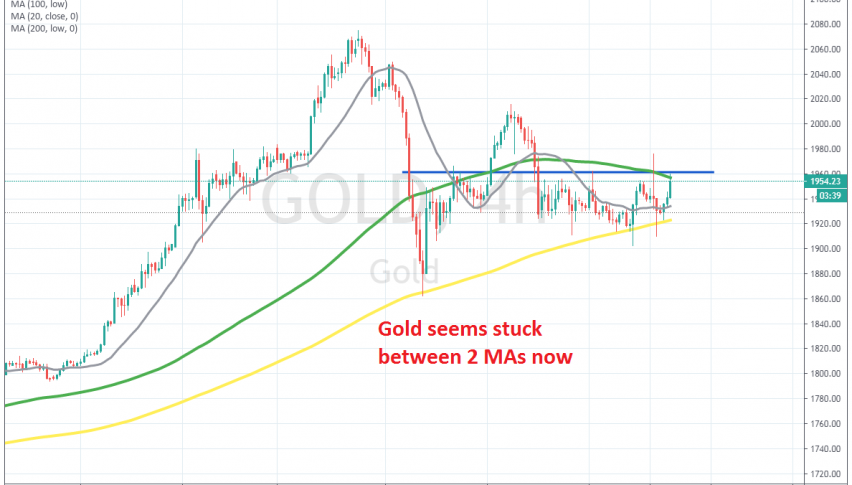
GOLD has been bullish for a couple of years, but this year it absolutely surged higher as, the sentiment turned negative due to the coronavirus and the lock-downs. As a result, Gold broke above the previous record high, pushing also above $2,000 until early August.
But, the price reversed from up there, after forming a doji candlestick at the top on the H4 chart, which is a bearish reversing signal. Gold lost more than $200 during that pullback, but the 200 SMA (yellow) held as support and the price bounced back up.
The price pushed above the 100 SMA (green) for some time, but turned down again, although the 50 SMA has been holding as support since then, despite being pierced a few times. But, the 100 SMA is turning into resistance now, also helped by a resistance zone that has formed around $1,960. This might be a good place to sell Gold, but the USD has turned quite weak again today, so it’s dangerous buying the USD now. We will see how Gold reacts around here and maybe open a trade after that.
- Check out our free forex signals
- Follow the top economic events on FX Leaders economic calendar
- Trade better, discover more Forex Trading Strategies
- Open a FREE Trading Account
- Read our latest reviews on: Avatrade, Exness, HFM and XM
Related Articles


Sidebar rates
Related Posts
