GBP/USD Heads for 1.40 As It Breaks the 50 Daily SMA
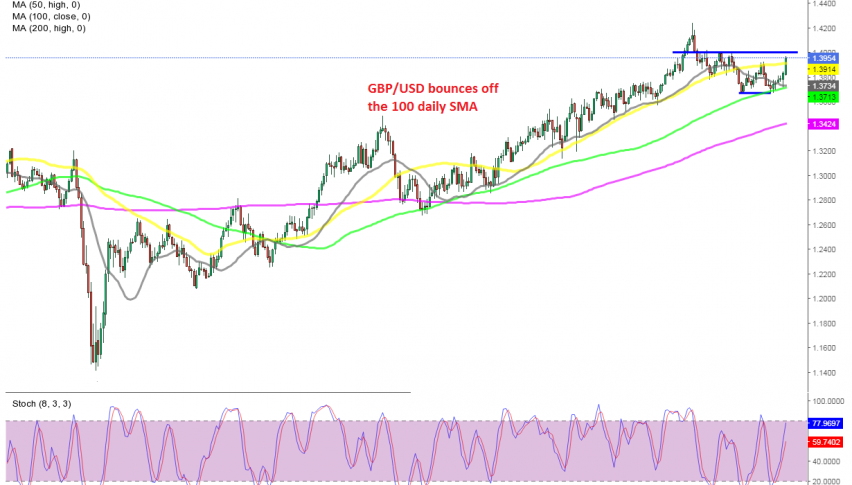
GBP/USD has bounced off the 100 SMA on the daily chart, heading for 1.40
[[GBP/USD-sponsored]]
GBP/USD was bullish for nearly a year, after reversing higher following the crash in February and March last year. In fact, this pair turned out to be one of the most bullish pairs during last year, increasing more than 28 cents from the bottom to the top in late February.
The decline in the USD has been the main reason for this decline, because the has been nothing to be bullish about the UK economy, which has been hit the hardest by the coronavirus restrictions. The service sector remains in recession as of March 2021.
Yet, GBP/USD pushed higher above 1.40, although it retreated lower during the last week of February and in March. The 50 SMA (yellow) which had been providing support on the daily chart since November last year was broken and it turned into resistance last month.
But, the 100 SMA (green) held as support around 1.3670, which turned into support for this pair. GBP/USD bounced off that moving average and today it broke above the 50 SMA as well, which opens the door for 1.40.
We will follow the price action when it gets close to that level and if there are bearish signs forming there, we might go short, since the US economy is booming at the moment and is gaining further momentum.
Although, the reopening of the UK economy will support the GBP, but on the other hand, the government is threatening with more restrictions after the new coronavirus strains. If we get a doji/pin candlestick up there and the decline in the USD starts to wear off, then we might take the opportunity.
- Check out our free forex signals
- Follow the top economic events on FX Leaders economic calendar
- Trade better, discover more Forex Trading Strategies
- Open a FREE Trading Account
- Read our latest reviews on: Avatrade, Exness, HFM and XM
Related Articles


Sidebar rates
Related Posts
