Yesterday’s Candlestick Points to a Bullish Reversal for Litecoin
Litecoin is trying to turn bullish today, after yesterday's pin candlestick
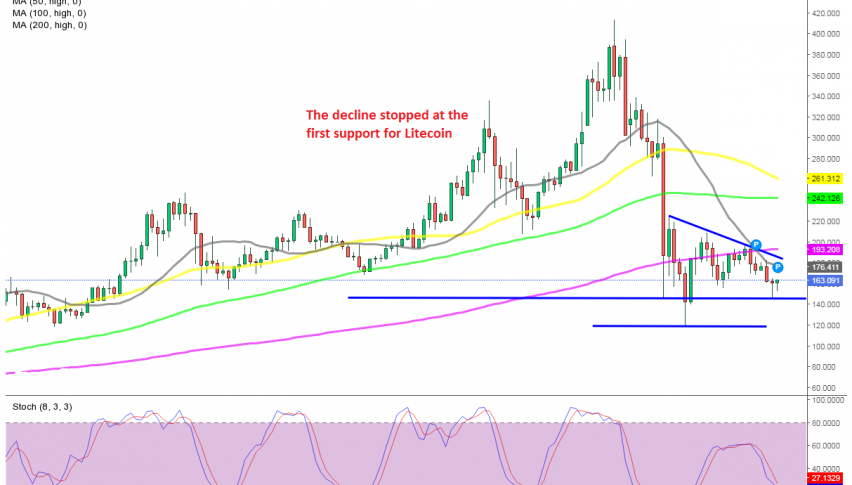
The decline in cryptocurrencies resumed again this week, particularly on Monday, when they lost more than 10% of their value, with Litecoin declining around $20. The decline continued during the European session yesterday, but it stopped at some point, and the price started to pull back up.
As a result, yesterday’s candlestick closed as a pin, which is a bullish reversing signal after the decline. The stochastic indicator is almost oversold on the daily time-frame, while today’s candlestick also looks like a pin so far, with the crypto trading near the highs for the day, after first trying the downside.
So, the price is reversing higher right now, after the initial decline today, which can be seen on the H4 chart below as well. LTC/USD is around $20 off the lows so far, and the sentiment is positive at the moment.

The 100 SMA will once again be the real test for buyers on the H4 chart
Although, as can be seen above, LITECOIN is facing both the moving averages and the descending trend line, which connects the lower tops. The 100 SMA (green) in particular has provided solid resistance recently, so that will be the real test for buyers, since the trendline also cones at the same level. We’re a bit far from that still, but let’s hope that buyers will keep pushing, since they are regaining some confidence today.
- Check out our free forex signals
- Follow the top economic events on FX Leaders economic calendar
- Trade better, discover more Forex Trading Strategies
- Open a FREE Trading Account
- Read our latest reviews on: Avatrade, Exness, HFM and XM
Related Articles
Sidebar rates
Related Posts
