Gold Violates Symmetrical Triangle Pattern – Brace for a Sell Position!
During Tuesday'sTuesday's Asian trading hours, the precious metal price extended its previous session bearish moves and dropped further arou
Written by:
Arslan Butt
•
Tuesday, June 15, 2021
•
3 min read
•
Last updated: Tuesday, June 15, 2021
During Tuesday’s Asian trading hours, the precious metal price extended its bearish moves of the previous session, dropping further, to below the $1,860 level. However, the selling bias surrounding the
GOLD price was mainly supported by the positive chatter over US President Joe Biden’s infrastructure spending plan, which tends to positively impact the market trading sentiment and contribute toward the losses in the safe-haven yellow metal.
Meanwhile, the upbeat sentiment regarding a post-Brexit trade deal with the UK and improving the coronavirus situation in Australia have further boosted the market trading mood, which was seen as another key factor that weighed on the safe-haven, gold. On the flip side, the stronger US dollar, backed by the upbeat US data that was released recently, has also played a major role in weakening gold prices, as GOLD usually moves inversely to the US dollar. Conversely, the ongoing fears of the coronavirus (COVID-19) in Japan and a broadly cautious sentiment before this week’s key event, the FOMC meeting, are probing the upbeat market mood, which may help to limit any deeper losses in the gold price. The precious metal is trading at 1,865.04 and consolidating in the range between 1,858.79 and 1,867.93.
Despite the cautious sentiment ahead of the US Retail Sales for May and Wednesday’s Federal Open Market Committee (FOMC) meeting, the market trading sentiment managed to extend its positive performance of the previous day, remaining well bid. The favorable appearance of Asia-Pacific stocks and upticks in the S&P 500 Futures highlight the risk-on mood. However, the reason behind the upbeat market moves could be attributed to the optimism concerning the coronavirus (COVID-19) vaccines and US President Joe Biden’s plans for continuation of the stimulus measures. Meanwhile, the upbeat sentiment over a post-Brexit trade deal with the UK and improving virus conditions in some major countries also favored the market bulls. In addition to this, the strong data from Japan and the US, which was released recently, also played a major role in supporting the market trading mood. Japan’s final printout on Industrial Production for April came in at 15.8%, against the initial estimate of 15.4%. The Group of Seven (G7) leaders’ latest discussions regarding the promotion of COVID vaccines and relief packages also boosted market optimism. It’s worth mentioning that traders in Australia, China, and Hong Kong return today, after a long weekend, and they might react to the latest catalysts from the Group of Seven (G7) meeting, which is a challenge for China. The positive development supported US stocks, and this was seen as one of the key factors that weakened the gold prices.
Despite the risk-on market mood, the broad-based US dollar succeeded in extending the positive performance we saw on the previous day, still hovering near multi-week highs on the day. The US dollar is getting support from the traders’ cautious mood ahead of any surprises from the US Federal Reserve, which is scheduled to begin a two-day policy meeting later in the day, and its latest decision is expected to be handed down tomorrow. On the other hand, the mounting optimism concerning the coronavirus (COVID-19) vaccine and progress on President Joe Biden’s further stimulus plans favored the USD bulls. In contrast to this, the gains in the US dollar could be short-lived, as the risk-on market sentiment tends to undermine the safe-haven assets, including the greenback. The stronger US dollar was viewed as a key factor that kept the gold prices under pressure, due to the inverse relationship between the prices of gold and the US dollar.
Looking forward, the market traders will keep their eyes firmly focused on the US Federal Reserve policy decision for further clues on inflation and the central bank’s monetary policy going ahead. Meanwhile, the US Producer Price Index, alongside retail sales and industrial production figures, which are due to be released later in the day, will also be key to watch. Apart from this, the updates over President Biden’s infrastructure spending plan could provide new direction for the bullion price.

Gold – XAU/USD – Daily Support and Resistance
S3 1,810.14
S2 1,835.21
S1 1,850.69
Pivot Point 1,860.29
R1 1,875.77
R2 1,885.36
R3 1,910.44
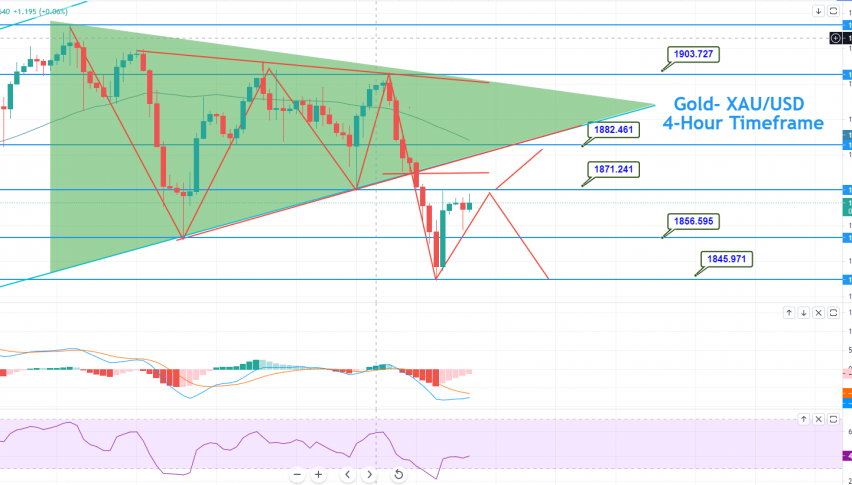
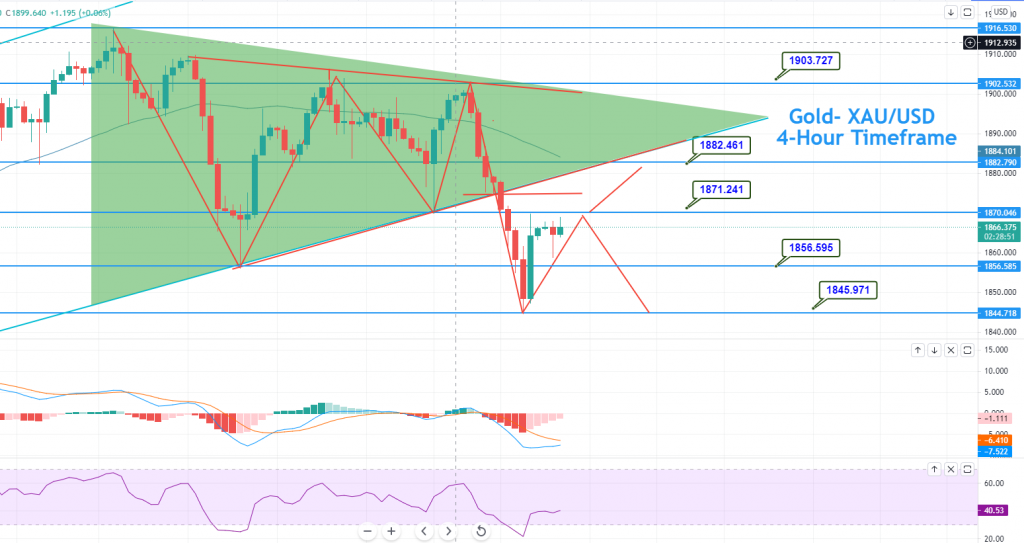
GOLD trading was strongly bearish, as it tested the low level of 1,845, but now it has bounced off to trade at the 1,862 level. Gold has violated the upward trendline and the symmetrical
triangle pattern at the 1,877 mark. On the lower side, the next support level for the precious metal remains at 1,857, extended by a double bottom support level. The other leading technical indicators, like the MACD and
RSI, support a strong selling trend. Today, we need to keep an eye on the 1,871 level, as a bullish trend could be seen over this level, until 1,883, and the selling bias remains strong below the same level of 1,871. Good luck!
Arslan Butt
Lead Markets Analyst – Multi-Asset (FX, Commodities, Crypto)
Arslan Butt serves as the Lead Commodities and Indices Analyst, bringing a wealth of expertise to the field. With an MBA in Behavioral Finance and active progress towards a Ph.D., Arslan possesses a deep understanding of market dynamics.
His professional journey includes a significant role as a senior analyst at a leading brokerage firm, complementing his extensive experience as a market analyst and day trader. Adept in educating others, Arslan has a commendable track record as an instructor and public speaker.
His incisive analyses, particularly within the realms of cryptocurrency and forex markets, are showcased across esteemed financial publications such as ForexCrunch, InsideBitcoins, and EconomyWatch, solidifying his reputation in the financial community.