The Line In the Sand Comes at $1 for Cardano ADA, Compound Forms a Bullish Reversal Pattern
Compound and Cardano trying to decide today, after bouncing higher yesterday
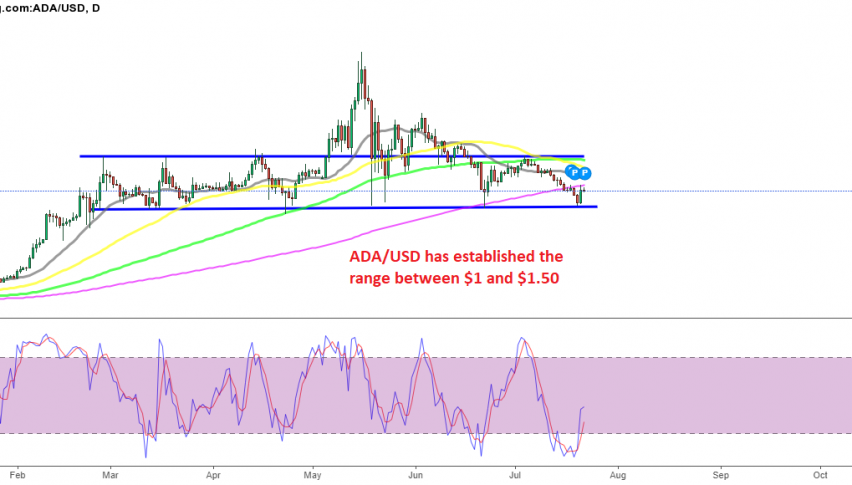
Cardano seems to have established a trading range. This range stretches between $1 and $1.50, where ADA/USD traded from late February until early May. Buyers went for another ride in the first half of May, putting Cardano in the group of currencies that continued to surge at that time, when most of the market was giving signals of a pullback, which didn’t take long to come.
After the crash in May, the bottom of the range held well as support, rejecting the price in Cardano twice. The price came back down at the support in June, but the support at $1 rejected the price once again, after forming a doji candlestick above it – which is a bullish reversing signal – after the decline. The ADA coin climbed to the top of the range, but failed to break above the resistance and the moving averages, which added further strength.
Cardano Live Chart
Cardano has come back down in the last two weeks, following the bearish sentiment in the crypto market, and we didn’t see any buying attempts whatsoever during that period, which was worrisome for cryptocurrency investors. But, the support at $1 held again, and yesterday we saw a bounce off of it, as the crypto market turned bullish all of a sudden. So, $1 is where the line in the sand stands for Cardano, and it seems a good place to go long from.
We are not going long yet, since the price is still too close to the support area, so we will see how the price action reacts on another attempt at the support, because today, it is stalling at around $1.18. If the ADA/USD retreats lower, and sellers hesitate above $1 again, we might open a buy Cardano signal down there.
Compound Analysis – COMP/USD Daily Chart

Compound trying to decide below the 200 SMA
Switching to the Compound coin, we can see that the latest low was higher than the low in May, and much higher than the low in June, showing that buyers are starting to come back in. The price formed a hammer candlestick on Tuesday which, once again, is a bullish reversing signal, with it reaching a low of around $315.
Yesterday the bullish move came, and the COMP/USD bounced higher, to $400. But, that’s where buyers met the 200 SMA (purple) on the daily chart, and they have been having second thoughts here. On one side, they seem hesitant to push above it, because cryptos have been really bearish since China brought the war on cryptocurrencies to the surface in May.
Compound Live Chart
On the other hand, the price is not turning bearish like it did after every retrace up in the last two months So, Compound coin traders are trying to make a decision now. If the 200 SMA goes, then the 100 SMA comes into play at $500. So, we might try to buy the break above the 100 SMA if that happens, or wait for the price to retreat to the 50 daily SMA (yellow) and go long from there.
- Check out our free forex signals
- Follow the top economic events on FX Leaders economic calendar
- Trade better, discover more Forex Trading Strategies
- Open a FREE Trading Account
- Read our latest reviews on: Avatrade, Exness, HFM and XM
Related Articles
Sidebar rates
Related Posts
