Solana, Fantom Crypto Update – SOL and FTM Finding Support at the Last Defense
Fantom and Solana bouncing off the 200 SMA on the H4 chart
Cryptocurrencies are in the middle of a bearish move. But this period might have come to an end, after seeing some decent support in the market today and the beginning of a trend reversal possibly? All cryptocurrencies have bounced higher today, around 10% off the lows, which is not bad after such a decline this week, so let’s have a look at Fantom and Solana if they are putting up a decent fight too.
Fantom Coin Analysis – The Previous High at $0.95 Holds
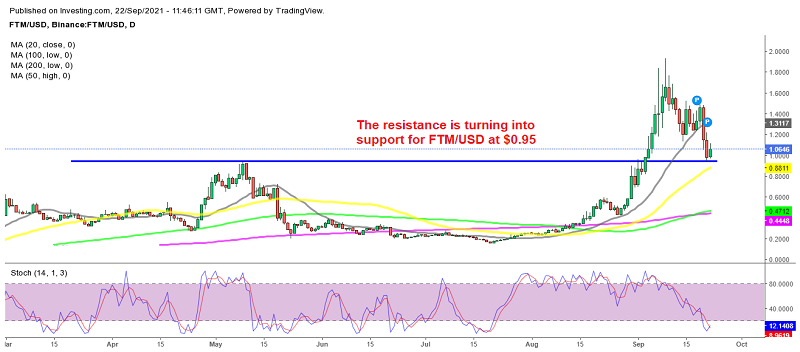
We have covered the Fantom coin often recently, but this crypto is quite interesting because it remained bullish until late and is a prime candidate to surge back up when the sentiment reverses in the crypto market. It kept surging higher to $1.9350, even when the bearish momentum had engulfed the crypto market and it didn’t even mind the first crash two weeks ago.
Although, eventually the decline in the market started pulling down FTM/USD as well but it found support at the 20 daily SMA for some time. That moving average was broken as well, when the second bearish leg came, but today we see that the price is bouncing off the previous high at $0.95, which might have turned into support now. The stochastic indicator is oversold now, so this might really be the beginning of the bullish reversal.
Fantom H4 Chart Analysis

The 200 daily SMA is holding for the moment
On the H4 timeframe chart, we see that all moving averages have been providing some sort of support for Fantom. The 20 SMA (gray) was pushing the price higher when the bullish momentum was strong, the 50 SMA (yellow) held for a little while and the 100 SMA (green) did a really good job.
Although it was broken and now only the 200 SMA stands in the way for further losses. Today we are seeing a bounce of this moving average, which comes at the same level as the 200 SMA (purple), so let’s hope that the trend reverses, since we are long on FTM/BTC.
Solana Coin Analysis – The Previous High at $0.95 Holds

The 200 SMA is holding on the H4 chart in Solana too
Solana was another pretty bullish crypto until a couple of days after the flash crash in the market two weeks ago. But it reversed after forming a big doji candlestick at the top, which comes at around $216. Almost exactly like in the Fantom H4 chart, moving averages have been doing a good job in providing support for Fantom.
They were broken eventually and the 50 SMA (yellow) even turned into resistance for SOL/USD. But the 200 SMA (purple) held as support despite being pierced briefly and now we are seeing a bounce. So, chances are that Solana might turn bullish as well from here on. We are thinking of opening a buy signal, which you can find on our forex signals page.
- Check out our free forex signals
- Follow the top economic events on FX Leaders economic calendar
- Trade better, discover more Forex Trading Strategies
- Open a FREE Trading Account
- Read our latest reviews on: Avatrade, Exness, HFM and XM
Related Articles


Sidebar rates
Related Posts
