Algorand Faces Resistance as Cosmos Retraces to Support. What to Expect

ALGO/USD Looking Down
Algorand (ALGO/USD) moved up to 2.08 on October 4, from a low of 1.5 on September 29. The crypto token is still trading below its all-time high over 2.5, which it reached on September 13, before the sellers took control and pushed prices downwards. Can Algorand reclaim the previous highs, or is a downtrend imminent?
Currently, ALGO/USD seems to have hit resistance and it could be retracing before the trend continues. At the time of writing, ALGO/USD was trading at 1.97, and looking to go lower.
Still, the crypto market is showing a bullish bias. Bitcoin, Ethereum and Binance Coin have gained 3.13%, 0.7% and 1.91%, respectively, in the past 24 hours. Most coins in the rest of the crypto market are showing bullishness, and Algorand could also ride the wave.
Important development – On September 29, Algorand announced the launch of the Algorand Virtual Machine, which enhances the development of DeFi Apps. According to Cointelegraph, the new platform provides developers with tools to create smart contracts. This news seems to have enhanced the bullish sentiment for Algorand, as it has been rising since then.
– A Daily Chart Technical Outlook
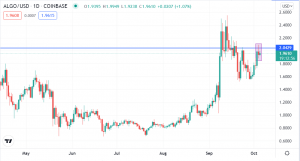
Looking at the daily chart above, ALGO/USD has retraced to consolidation at the resistance level. We can see a bearish pin bar below the resistance, which could push the prices down.
ALGO/USD Trade Idea
Although I maintain a bullish view of ALGO/USD, watching the price behavior at the current retrace is important before going long. I interpret the formation of a bearish pin bar as an attempt by the crypto token to break lower. Short-term sell trades can be taken at the current level, aiming at 1.7.
If prices were to break above the resistance, I would open a buy trade, with targets at 2.09, 2.22 or 2.4.
ATOM/USD on a 50% Retrace
– A 4-Hour Technical Outlook
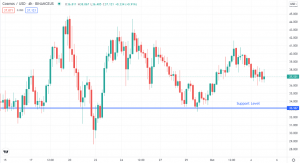
Cosmos (ATOM/USD) found support at 33 on September 30, before moving on an upward trend to a high of 41 on October 2. Currently, prices are almost at a 50% retrace, trading at 37. At this level, a bullish reversal price signal could take the price up to the previous highs, and a bearish reversal pattern would confirm the continuation of the downward trend towards the support.
ATOM/USD has shed 1.36% in the past 24 hours, in a losing streak that has also seen it dip 2.34% in the past week.
ATOM/USD Trade Idea
With the prices at the 50% retrace, I would only enter a buy trade with the confirmation of a price reversal signal. At the moment, a bearish pin bar can be seen forming at the retrace, which points to a further downtrend. At this level, prices could drop towards the support area.
Alternatively, I recommend a buy entry at the current retrace, once there is a confluence of a bullish price reversal signal at the 33-support level. I would aim at 41, 42, or the all-time high of 45, as my profit targets. Happy trading!
- Check out our free forex signals
- Follow the top economic events on FX Leaders economic calendar
- Trade better, discover more Forex Trading Strategies
- Open a FREE Trading Account
- Read our latest reviews on: Avatrade, Exness, HFM and XM
Related Articles
Sidebar rates
Related Posts
