Alibaba Trending Down, Google Trending Up – Opposite Chart Setups
We are long on Google shares, while shorting Alibaba today
We have recently incorporated stock signals into our website, and will soon open a live stock market section. We already had sections for indices, but this new one will be for individual shares only. We had some trouble with Apple signals, but the glitch seems to be fixed now, and we are trading Google and Alibaba shares at the moment.
Google has had an incredible run since March last year, after the initial coronavirus crash. All the money that has been thrown around by central banks and governments around the world has been keeping stock markets floating, while tech companies have benefited from the increased use of the internet during the restrictions and lockdowns.
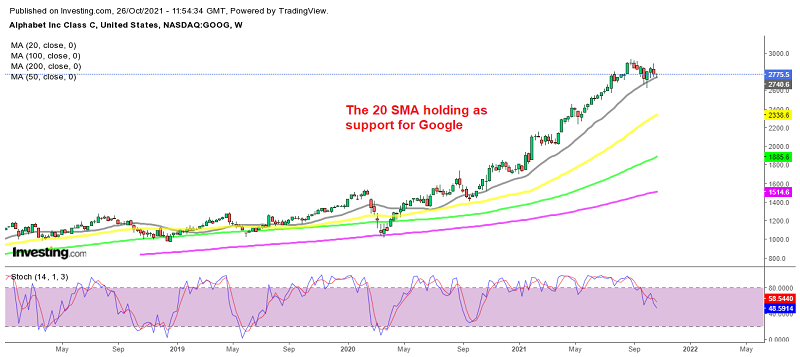
On the weekly chart above, we see that moving averages haven’t been able to catch up with the price since October last year, during the US presidential elections. This confirms the strength of the uptrend. The 20 SMA (gray) only caught up this month, and it is acting as support. We decided to open a buy Google signal at this moving average, although the price returned to it last week, after bouncing off the 20 SMA earlier this month.
Google Daily Chart – The 20 SMA Holding as Support

The 100 SMA acting as support
On the daily chart, we see that the 50 SMA has been acting as the ultimate support for a year. But this time, the retreat at the end of September was deeper, as the Chinese economy cooled off, while the FED decided to start tightening their policy, which weakened stock markets.
The 50 daily SMA (yell0w) was broken, but the 100 SMA (green), held as support here. The price bounced off that moving average and increased above the 50 SMA, which made it seem like the bullish trend was back on. But, the price reversed back down, and now Google is trading above the 100 SMA. I think that this moving average will hold as support, and we will see Google resuming the bullish trend soon.
Alibaba Weekly Chart – The 20 SMA Acting as Resistance

Is the retrace higher over for Alibaba?
While stock markets across the globe have been running higher, Alibaba reversed down in October last year and it has now been declining for about a year, losing $344 billion in value in the process. The Chinese government is not only cracking down on cryptos, but also on “non-conforming” companies and individuals, and Jack Ma, with his Alibaba, has been one of the main targets.
When Biden took over, China got a wink that the US wasn’t going to intervene in that region, so China resumed its pressure on Hong Kong and progressed with the crackdown. Alibaba has been feeling the weight, and the 20 SMA has turned into resistance here. We decided to open a sell signal on Baba stocks, since this retrace seems almost complete.
- Check out our free forex signals
- Follow the top economic events on FX Leaders economic calendar
- Trade better, discover more Forex Trading Strategies
- Open a FREE Trading Account
- Read our latest reviews on: Avatrade, Exness, HFM and XM
Related Articles


Sidebar rates
Related Posts
Ava
