The First Test for Litecoin (LTC), Cardano (ADA) Buyers, as They Bounce off Support
Cardano ADA and Litecoin LTC are facing the 50 daily MAs above, as they bounce off support
Finally, cryptocurrencies are showing some bullish signs after being bearish for three months. They have lost considerable value during this time, with Bitcoin falling from $70,000 to $33,000 and Ethereum declining from $5,000 to $2,200. The decline stopped two weeks ago, but the price was sticking to the support zone for Litecoin LTC and Cardano, and showing no willingness to turn bullish.
However, the sentiment has improved in the last few days, with Bitcoin climbing to $42,000, while Ethereum has pierced the $3,000 level. This hasn’t been the only attempt to reverse the bearish sentiment in the crypto market, and LTC and ADA are facing some decent resistance indicators above, so let’s see if they will be able to overcome them.
Litecoin Heading to the 50 SMA After Bouncing Off Support
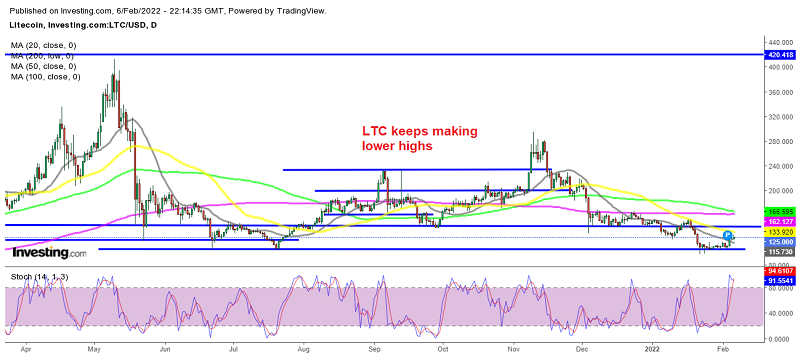
Litecoin is rolling out what is probably its biggest upgrade, but that hasn’t generated much interest for the LTC token, which slid from below $300 to $100, even piercing that major support level, although there was no daily close below that. So, the support zone around $100 stood its ground, and after trading above that level for two weeks, LTC/USD has started to bounce, as the crypto market retraces higher.
However, it is a bit early to tell whether the trend is really turning bullish. The MimbleWimble upgrade is expected to make Litecoin transactions more secure and scalable, which should help the adoption. But, the sentiment has been bearish in the market, so LTC hasn’t been able to show any signs of life. Now, if the sentiment remains positive, we will see whether Litecoin is able to overcome the 50 daily SMA (yellow) which has acted as resistance before.
Cardano Daily Chart Analysis – Will ADA Break Above the Triangle?

Cardano forming a triangle on the daily chart
Cardano also launched its biggest upgrade in September last year, but it failed to gather much interest. It has been sliding lower since then, even during October, when the crypto market was making some massive gains. Moving averages have turned into solid resistance in the daily chart, particularly the 50 SMA (yellow) and the 100 SMA (green).
The congestion-related problems with the first decentralized exchange (DEX) SundaeSwap, which was released this year, didn’t help the situation for ADA either. There are more developments for Cardano, as Plutus, which is Cardano’s execution platform for deploying smart contracts, is expected to increase the size of the memory unit, while the blocksize might increase by up to 11%, in order to make Cardano more scalable. Now the price has bounced off the support at $1, but ADA/USD is also facing the 50 daily SMA (yellow). which will be an important test for buyers. If they push the price above that, they have a decent chance of resuming the bullish trend.
Cardano Coin ADA Live Chart
- Check out our free forex signals
- Follow the top economic events on FX Leaders economic calendar
- Trade better, discover more Forex Trading Strategies
- Open a FREE Trading Account
- Read our latest reviews on: Avatrade, Exness, HFM and XM
Related Articles


Sidebar rates
Related Posts
