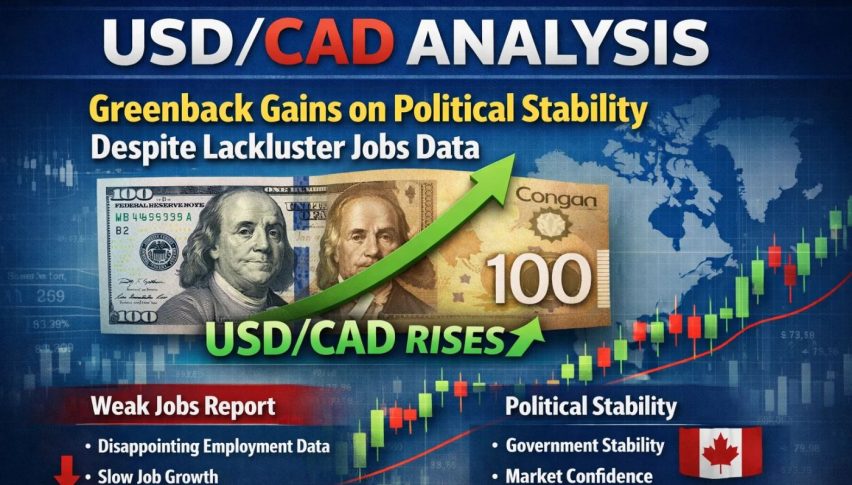
Long on USDCAD at Support After Canada Manufacturing PMI
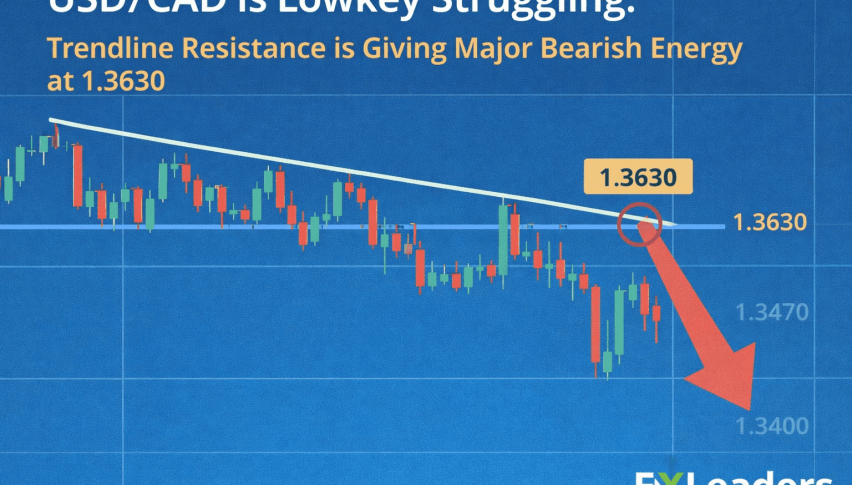
The USDCAD rate still remains in a triangle, and today's US or Canadian manufacturing PMI data did not provide a breakout.

The USDCAD rate still remains in a triangle, and today’s US or Canadian manufacturing PMI data did not provide a breakout. The pair challenged the bottom of the triangle, shown by the 200 SMA on the chart below, following lower US manufacturing and manufacturing prices, which indicated that inflation is also slowing in this sector.

Analysis for Canadian Manufacturing
Canada’s manufacturing sector remained subdued in May, extending the downturn to 13 months. Declines in output and new orders accelerated, with production experiencing its steepest decline of the year. The drop in new export orders, particularly from the US, further dampened the sector’s performance.
Despite the challenging operating environment, business confidence strengthened to a ten-month high, driven by growth projections and expectations of economic stability. Employment increased, indicating a degree of resilience in the face of subdued production and new orders.
USD/CAD Chart H4 – Can the 200 SMA Hold for Long

However, input costs continued to rise, influenced by vendor pricing and supply chain delays, while competitive pressures limited firms’ ability to pass on these costs to consumers. Output charge inflation remained minimal, reflecting the constrained pricing power of manufacturers.
Overall, while there are signs of cautious optimism in Canada’s manufacturing sector, sustained recovery will depend on factors such as improving global demand, resolution of supply chain disruptions, and effective management of cost pressure.
USD/CAD Live Chart
- Check out our free forex signals
- Follow the top economic events on FX Leaders economic calendar
- Trade better, discover more Forex Trading Strategies
- Open a FREE Trading Account
- Read our latest reviews on: Avatrade, Exness, HFM and XM
Related Articles

Sidebar rates
Related Posts
