FTSE Drops 0.8% After Worse than Expected Inflation Data
Inflation data today showed a slightly higher than forecast YoY rate at 2%, analysts were expecting a decline to 1.9% from last month’s 2%
Inflation data today showed a slightly higher than forecast YoY rate at 2%, analysts were expecting a decline to 1.9% from last month’s 2% reading.
Core Inflation also remained steady at 3.5%as forecast. However, the market had been expecting proof of a decline in price increases. And a small decrease in the YoY inflation might have propped the market.
But core inflation is still well over the 2% target of the BoE, and there was no help from the broader inflation gauge. Hopes for a cut in rates at the September meeting have shrunk rapidly today.
Tomorrow we will get employment data, the market is expecting an increase in jobs of 18k after last month’s decline of 139k. An increase in jobs, which is seen as inflationary, may dampen even further any hopes for a rate cut sooner rather than later.
The stock market is more concerned about seeing interest rates lower than an expanding economy. It’s been a while now that data such as an increase in employment often creates a selloff rather than a rally.
On the other hand, the pound benefited from the slightly hawkish inflation data, the GBP/USD rallied 40 pips after the news release.
Technical View
The day chart below for the FTSE shows a market in a sideways trend for the past 10 sessions. The market has also been in the Ichimoku cloud (green area), which is considered no-man’s land.
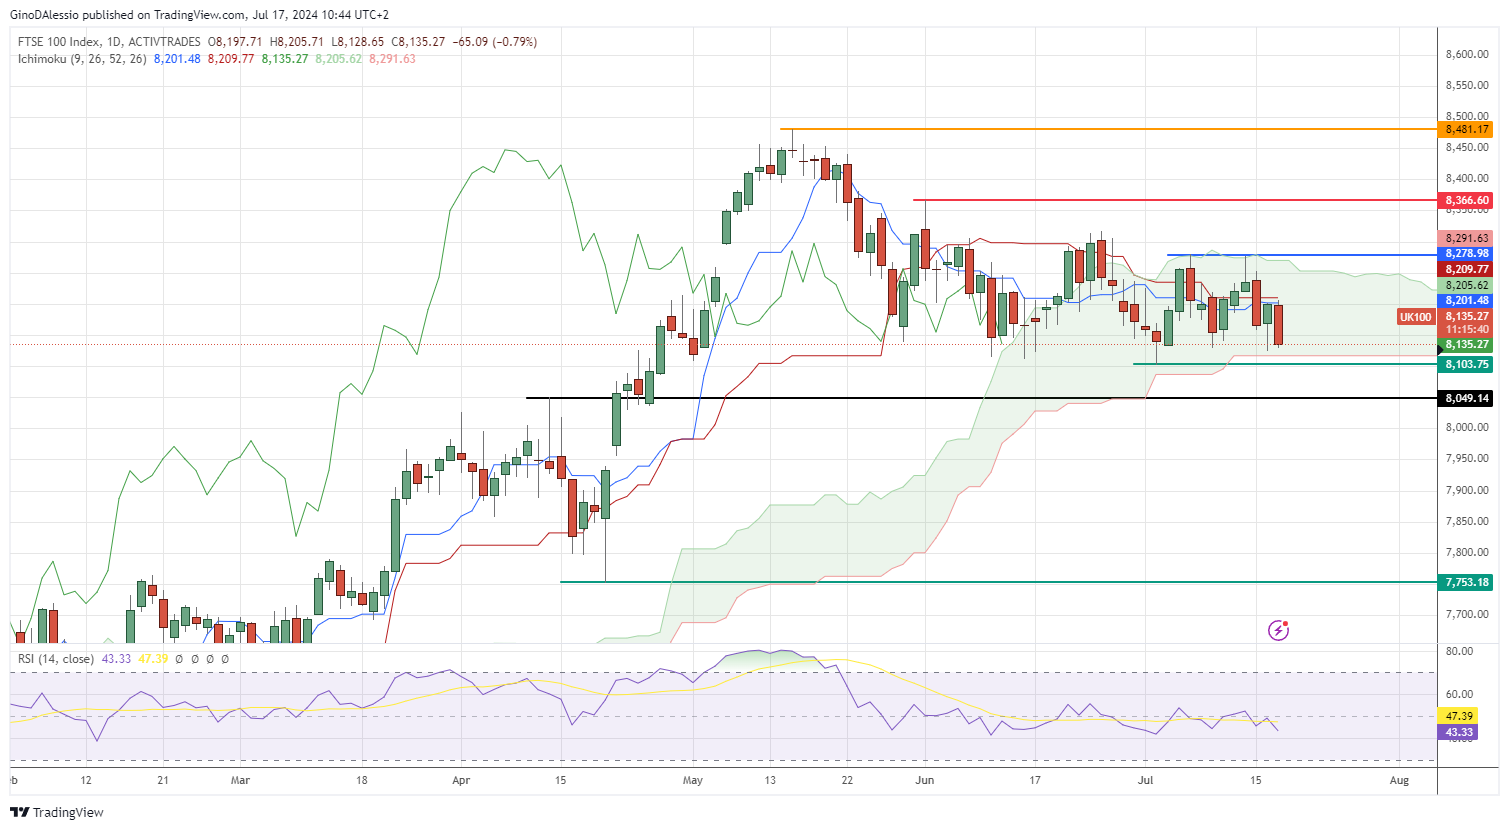
The uncertainty is apparent from the lateral trading, and the fact that the market has been limited by the top and bottom of the cloud in a precise way. The RSI has also hovered around the 50 level, a clear indication of the lack of a trend.
The breakout from the cloud will give an indication of the next trend’s direction. The next resistance for a bull trend is at the top of the cloud at 8,278 (blue line) which also coincided with a double top.
Should that break, further resistance can be found at a previous high of 8,366 (red line). However, to consider a bull trend back in place the market needs to close above its all-time high of 8,481.
To the downside, a breakout would find support at a previous high of 8.049 (black line). If that level of support is broken, then the next support would be at 7,753 (green line) which is the low of a dip in April.
- Check out our free forex signals
- Follow the top economic events on FX Leaders economic calendar
- Trade better, discover more Forex Trading Strategies
- Open a FREE Trading Account
- Read our latest reviews on: Avatrade, Exness, HFM and XM
Related Articles


Sidebar rates
Related Posts
