CAC: Investor Attention Turns to EU Inflation & Trump Tariffs
EU inflation shows expected rise, keeps rate cut hopes alive. Trump reiterates his intention of slapping high tariffs across the board.
EU inflation shows expected rise, keeps rate cut hopes alive. Trump reiterates his intention of slapping high tariffs across the board.
- EU inflation comes in at
- Trump post on social media confirming tariffs
- CAC remains in bearish trend
The CAC continued the recent rally today, up 2.6% over the past two days, after starting the year by dropping nearly 1%.
EU Inflation and ECB Policy
Today’s data for EU YoY inflation came in as forecast at 2.4%, a slight increase from last month at 2.2%.
The latest data might lead to a delay in the next rate cut which the market has been expecting for January. Despite the small increase, the ECB should still be on track for further cuts in the coming months as the economy still shows signs of weakness.
Consumer confidence is weakening and activity in manufacturing and services are still showing contraction. I see it hard to believe that the ECB will pause in January for a small uptick in inflation.
CAC Live Chart
Trump Confirms intentions on Tariffs
Trump took to his social media platform Truth Social to reiterate his commitment to high tariffs across the board. The comment came after there had been indications that perhaps the tariffs might not materialize.
The DOW retreated from its high yesterday, after being up nearly 1% on the day to close up only 0.11%. EU peers seem less affected by the comments and continue their upward trend.
The play on tariffs is that a 10% tax on imports could be offset by a similar devaluation of the euro.
The EUR/USD has lost 4.6% since Trump won the presidential election November 5, last year. While a devalued currency can offset tariffs, it will also raise the cost of imported products and put pressure on inflation.
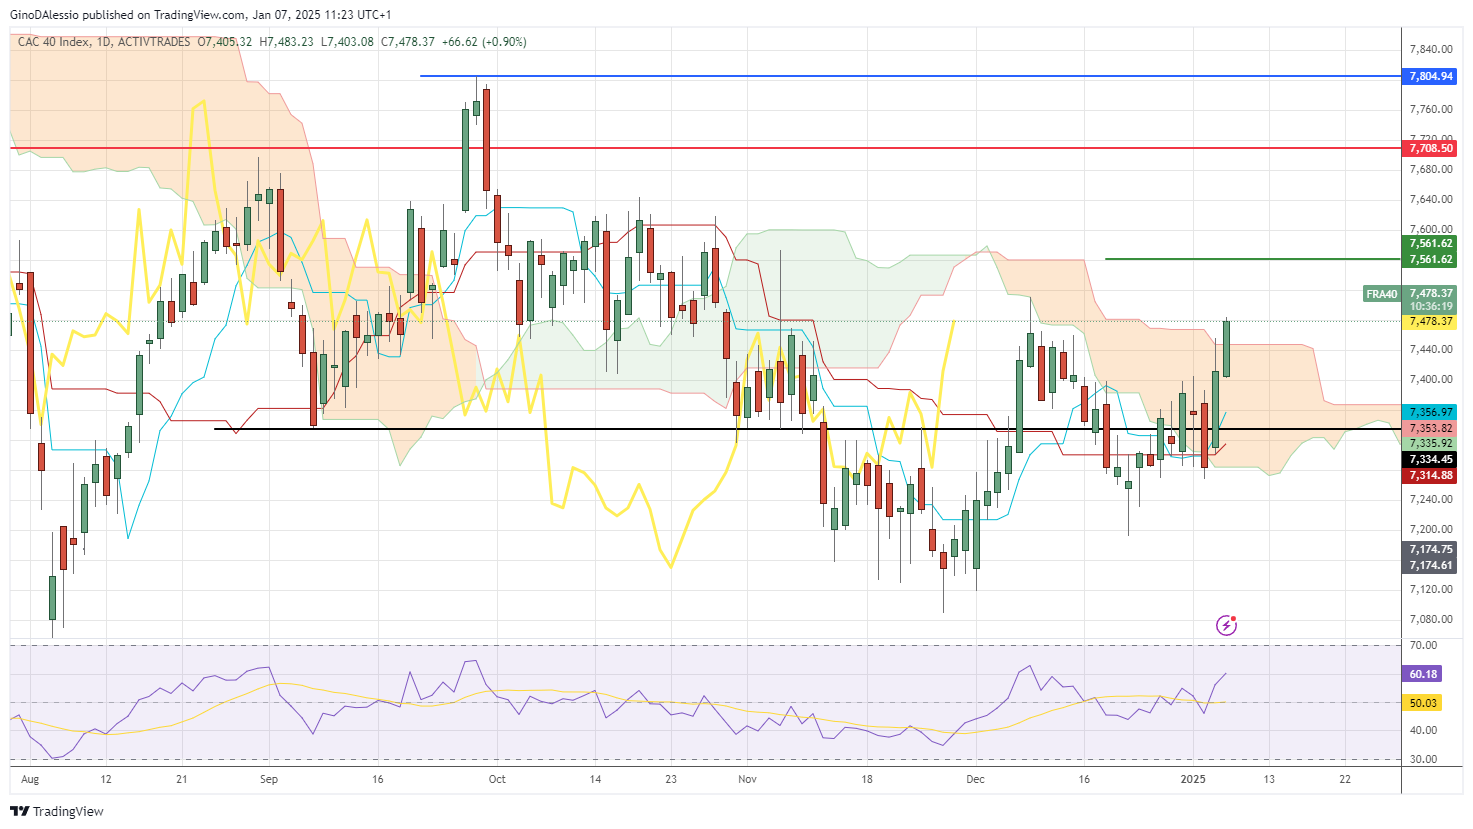
CAC Day Chart
The day chart above for the CAC shows a market in a technical bearish trend, with prices still below the Ichimoku cloud.
However, the recent trend higher failed to break above the cloud in December, the second leg higher is breaking the cloud with today’s candle, if it holds.
But to see the Ichimoku system indicating a bullish trend we would also need the lagging line (yellow line) to cross above the cloud. Failure to break above the cloud would indicate a possible reversal point (green line).
- Check out our free forex signals
- Follow the top economic events on FX Leaders economic calendar
- Trade better, discover more Forex Trading Strategies
- Open a FREE Trading Account
- Read our latest reviews on: Avatrade, Exness, HFM and XM
Related Articles

Sidebar rates
Related Posts
