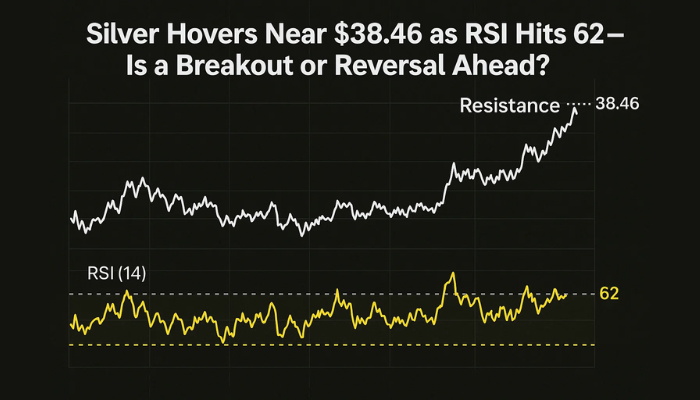
Silver Hovers Near $38.46 as RSI Hits 62—Is a Breakout or Reversal Ahead?
Silver (XAG/USD) is consolidating below $38.46—a level defined by the 23.6% Fibonacci retracement and the descending trendline from the July
Quick overview
- Silver (XAG/USD) is currently consolidating below $38.46, forming a symmetrical triangle that may lead to a breakout.
- Recent US macro data shows a decline in retail sales and rising jobless claims, creating uncertainty and boosting safe-haven assets like silver.
- The technical outlook for silver is neutral-bullish, with the RSI climbing but not yet overbought, indicating potential for further upside.
- Key resistance at $38.46 and support at $38.09 will determine silver's next move, with traders awaiting a decisive break.
Silver (XAG/USD) is consolidating below $38.46—a level defined by the 23.6% Fibonacci retracement and the descending trendline from the July high near $39.13. The price action is forming a textbook symmetrical triangle, often a precursor to a breakout as volatility compresses.
This pause comes as US macro data is causing fresh uncertainty. Retail sales fell more than expected in June, core retail sales down 0.3% and headline sales 0.9%. Initial jobless claims rose to 233,000, further signs of softening labor market momentum. While this puts pressure on the US dollar and Treasury yields, it also boosts safe-haven assets like silver.
The Fed’s policy path is unclear. With inflation above target but economic indicators softening, markets are split between one more hike or a hold. In this environment, silver’s resilience at resistance is noteworthy and may be hedging.
RSI Climbs, But Price Faces Triangle Test; Silver Outlook
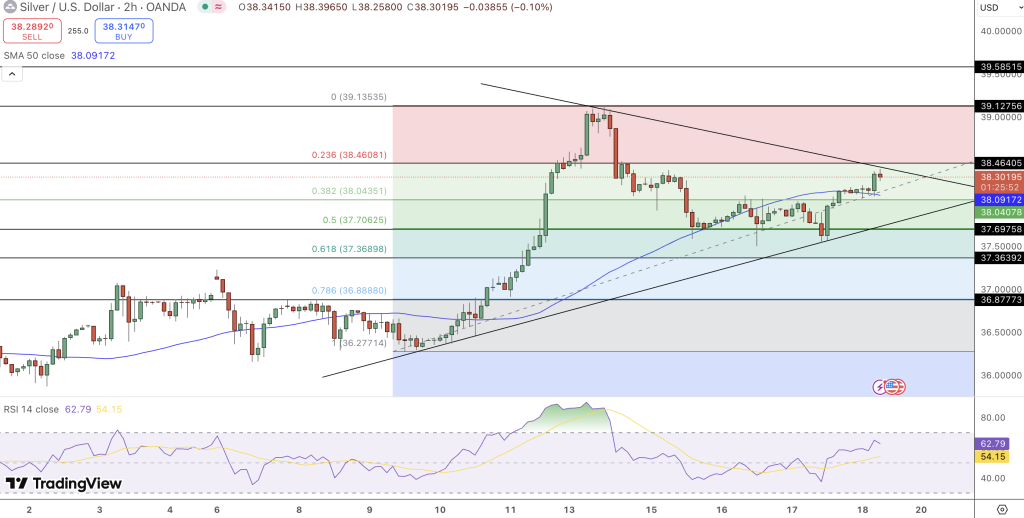
From a technical standpoint, silver has bounced from $37.36, the 61.8% Fib retracement that aligns with the trendline support. The bounce has taken prices above the 50-period SMA on the 2-hour chart, currently at $38.09, but the real test is ahead.
The RSI has climbed to 62.79, but not yet overbought. When RSI rises above 60 and price approaches resistance, traders look for volume confirmation or candle closes above the trendline to validate further upside.
So far, it’s neutral-bullish:
- RSI above 60, with room to run before overbought.
- Higher lows against descending highs—a tightening range.
- Fib levels as magnets and psychological anchors for traders.
Unless silver breaks above $38.46, price will continue to oscillate inside the triangle.
Silver Key Levels Define the Path Forward
With both macro and technical forces at play, silver’s next move depends on a clean break from this compression zone. Here’s what matters most:
Resistance to Watch:
- $38.46 – Triangle resistance + 23.6% Fib
- $39.13 – Swing high
- $39.58 – Multimonth high
Support Levels:
- $38.09 – 50-period SMA
- $37.70 – Mid-Fib
- $37.36 – 61.8% Fib
If silver breaks above $38.46 with volume and holds above the trendline, it could retest $39.13. If it can’t hold above $38.09 or breaks below $37.70, the bears will be back in control.
Conclusion
Silver is at a junction, where technical and macro forces collide. With RSI bullish and the Fed’s path unclear, traders are waiting for a trigger. Whether it’s inflation data, jobs reports or Fed speak, the reaction at $38.46 will be the key for July.
- Check out our free forex signals
- Follow the top economic events on FX Leaders economic calendar
- Trade better, discover more Forex Trading Strategies
- Open a FREE Trading Account
- Read our latest reviews on: Avatrade, Exness, HFM and XM
Related Articles
Sidebar rates
Related Posts
