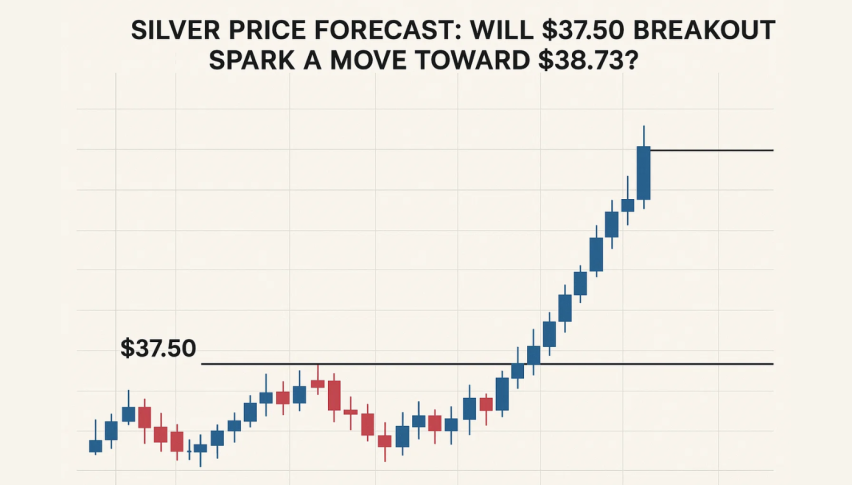
Silver Price Forecast: Will $37.50 Breakout Spark a Move Toward $38.73?
Silver (XAG/USD) is looking like a textbook bullish setup after last week’s selloff, currently consolidating just below the $37.50...
Quick overview
- Silver (XAG/USD) is consolidating below the $37.50 resistance zone after a recent selloff, currently trading at $37.44.
- Weaker US jobs data has increased speculation of a Federal Reserve rate cut, boosting demand for precious metals like silver.
- Technical indicators suggest a bullish pennant pattern, with a potential breakout above $37.50 leading to targets of $38.29 and $38.73.
- If silver fails to break above $37.50 and drops below $37.14, it may retest lower levels around $36.67 or $36.21.
Silver (XAG/USD) is looking like a textbook bullish setup after last week’s selloff, currently consolidating just below the $37.50 resistance zone. As of Tuesday’s session, silver is trading at $37.44, up 0.1%, following the broader gold market after weaker than expected US jobs number caused a drop in Treasury yields and the US dollar.
The weaker jobs number and downward revisions of 258,000 jobs for May and June has increased the speculation that the Federal Reserve is going to cut rates. The CME FedWatch Tool is now showing 92% probability of a September cut and that’s boosting demand for precious metals. Lower interest rates reduce the opportunity cost of holding non-yielding assets like silver and gold and often triggers momentum in these markets.
San Francisco Fed President Mary Daly’s dovish comments also helped silver to recover from the $36.21 low seen last week. But while the macro is setting the backdrop, the technicals tell the immediate story.
Silver Technical Setup: Bullish Pennant Nearing Apex
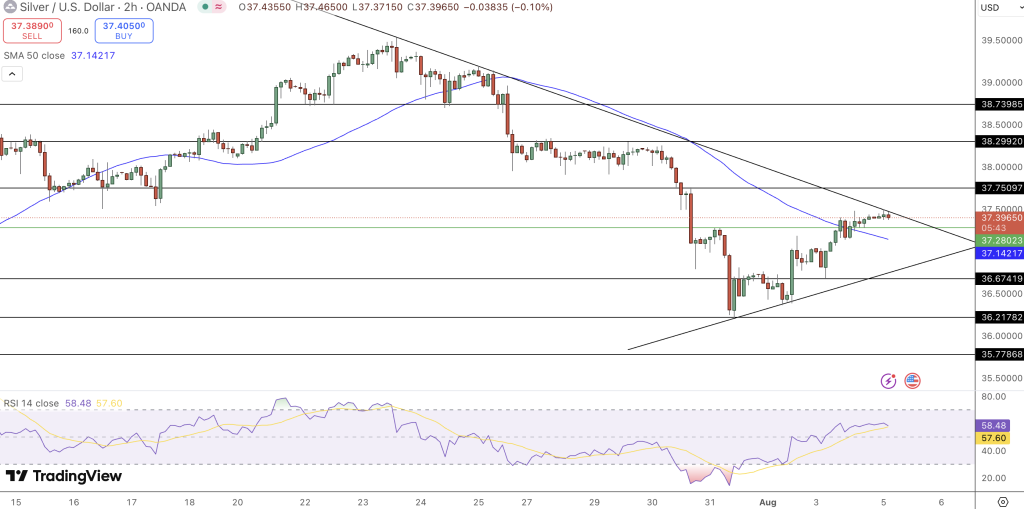
On the 2-hour chart, silver is trading inside a converging triangle—marked by the rising trendline support from $36.21 and the descending resistance from the July highs around $37.75. That’s a bullish pennant pattern that has traders waiting for a breakout.
Here’s what to look out for:
- RSI is rising, currently at 58.48, not yet overbought.
- 50-period SMA is holding as support at $37.14, the trend has turned from neutral to bullish.
- Candle bodies are shrinking and volatility is dropping—often a precursor to big moves.
- Horizontal resistance at $37.50–$37.75 has been tested multiple times and that increases the chances of a breakout.
If buyers can push price above $37.50, especially on rising volume, it could trigger follow through buying to $38.29 and even $38.73.
Silver Price Forecast: What to Watch
The bullish pennant pattern is suggesting silver is about to break out. Here’s a forecast breakdown based on technical and macro signals:
Bullish Scenario
- A close above $37.50, with momentum and volume, could confirm the breakout.
- Target 1: $38.29 (horizontal resistance)
- Target 2: $38.73 (prior swing high)
- Support/Stop-Loss: Below $37.14 (50-SMA and triangle base)
Bearish Alternative
- If $37.50 fails and price drops below $37.14, momentum will shift back to the downside.
- Then price may retest $36.67 or $36.21.
Final: Silver’s next move is all about $37.50. If it breaks higher, bulls are in control for the week. But without confirmation, it’s a wait. As always, don’t chase—let price confirm before you act.
- Check out our free forex signals
- Follow the top economic events on FX Leaders economic calendar
- Trade better, discover more Forex Trading Strategies
- Open a FREE Trading Account
- Read our latest reviews on: Avatrade, Exness, HFM and XM