Stellar (XLM) Holds Firm Above $0.40 Amid Strong Fundamentals and Bullish Technicals
In early August 2025, Stellar's native coin XLM showed amazing strength, rising 7% in the previous session to trade above $0.40 and breaking
Quick overview
- In August 2025, Stellar's XLM rose 7% to trade above $0.40, breaking out of a falling wedge pattern amid positive technical signals and a partnership with Visa.
- The collaboration with Visa, which will utilize Stellar's blockchain for stablecoin settlements, is expected to increase demand for XLM tokens.
- Technical indicators show a bullish setup for XLM, with significant support levels established and a recent increase in trading volume indicating institutional interest.
- Analysts predict that if XLM surpasses $0.50, it could potentially reach $0.52 or even $1.50 by the end of 2025, though market volatility remains a concern.
In early August 2025, Stellar’s native coin XLM/USD showed amazing strength, rising 7% in the previous session to trade above $0.40 and breaking out of a key falling wedge shape. The rise comes after positive technical signals and a cooperation announcement with Visa, a global payments behemoth, that might change the game for XLM and lead to advances toward $0.50 and beyond.
Stellar-Visa Integration: Fundamental Catalyst for Long-Term Growth
The technical breakout of XLM happened at the same time as Visa’s statement that it would use Stellar’s distributed ledger technology in its stablecoin settlement network. This cooperation is a big deal for Stellar because it means that Visa’s infrastructure now solely supports Stellar as a non-proof-of-stake blockchain.
The integration makes Stellar the best network for sending money across borders and settling stablecoins. The blockchain has always been better at these things since it offers rapid transaction speeds and low fees. This agreement could lead to more demand for XLM tokens as more people use the network through Visa’s large partner ecosystem.
Peter Brandt, a veteran trader, is quite positive about Stellar and thinks it might become a “rock star” because of the way a massive symmetrical triangle pattern has formed. When these kinds of patterns break to the upside, they usually cause big price changes.
XLM/USD Technical Analysis Reveals Strong Bullish Setup Above Key Support
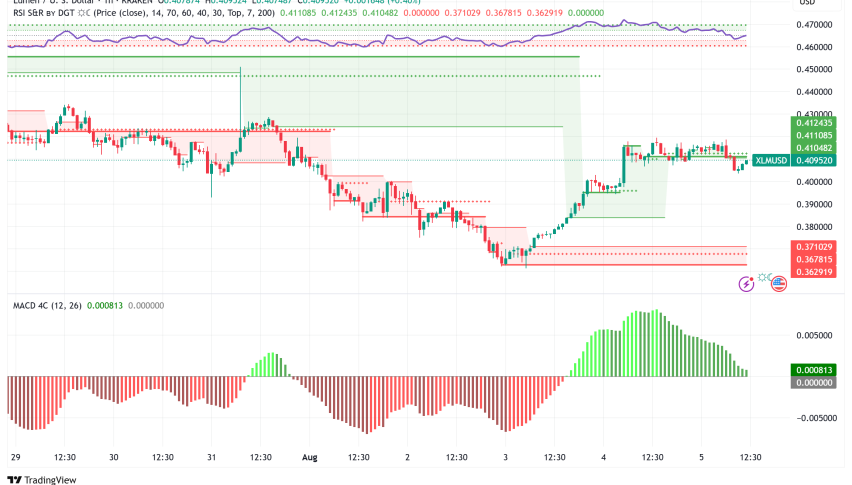
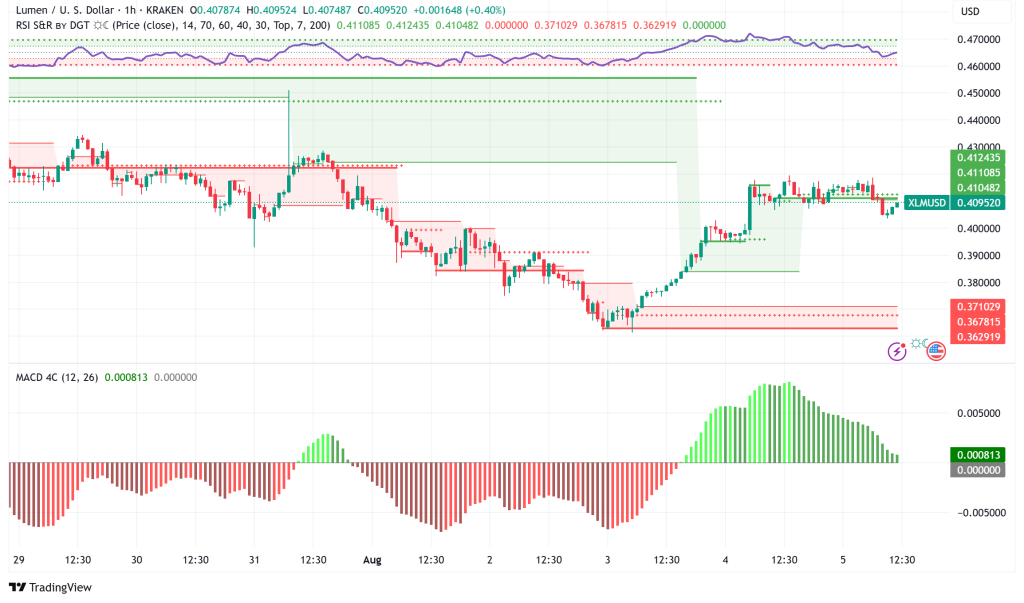
XLM’s recent price movement shows a classic falling wedge breakout on the four-hour chart, and the token has successfully defended the important $0.36 support zone. Around $0.40, the breakout above the upper trendline happened. This marked the conclusion of a three-week period of consolidation and could mean the commencement of a long-term rising surge.
Current technical indicators show that things are getting more and more optimistic. The Relative Strength Index (RSI) has risen to 59.27, which means that momentum is building and there is still room for more gains before the market becomes overbought. Most importantly, XLM is currently trading above its 50-period exponential moving average ($0.4069) and its 200-period EMA ($0.3868). These important levels are now working as dynamic support instead of resistance.
The shift has been confirmed by a huge increase in trading volume, which rose 50.05% to $564.03 million in the last 24 hours. This rise in volume points to institutional involvement rather than speculation by individual investors, which makes the breakthrough more likely to sustain.
Stellar (XLM) Price Prediction and Risk Assessment Point to $0.50-$0.52 Resistance
XLM’s immediate price objective is approximately $0.4969, which is a possible 20% gain from its current level of around $0.4135, based on the falling wedge breakout pattern. This aim is the same as a swing high set in mid-July and is the next big resistance level.
Analysts say that if XLM can break over $0.50, it might go up to $0.52 and then $0.60. Some optimistic predictions say that prices might rise by 5 times by the end of 2025, which could bring them close to $1.50. However, these predictions should be taken with a grain of salt because the crypto market is very unstable.
On-chain data backs up the positive story, as more whale wallets are holding above 10 million XLM tokens, which is a sign that they are accumulating. Inflows to exchanges are consistent, which means that big holders are keeping their positions instead of taking advantage of recent advances.
Risk Factors and Key Levels to Monitor
Even though the technical and fundamental outlooks are good, traders should keep an eye on a few important risk concerns. The RSI’s recent divergence implies that the price may be moving faster than the underlying momentum, which means that the current path will need to be supported by high volume. Also, the overall state of the cryptocurrency market could affect XLM’s performance, even if the fundamentals are good.
The breakout zone at $0.40 and the 50-period EMA at $0.4069 are two important support levels to keep an eye on. If the price breaks below these levels, it might end the bullish thesis and possibly lead to a retest of the $0.36 support zone.
- Check out our free forex signals
- Follow the top economic events on FX Leaders economic calendar
- Trade better, discover more Forex Trading Strategies
- Open a FREE Trading Account
- Read our latest reviews on: Avatrade, Exness, HFM and XM
Related Articles
Sidebar rates
Related Posts
