WTI Crude Oil Rises as Sanctions Loom, but Market Faces Mixed Signals
WTI crude futures climbed more than 2% toward the $60 mark on Friday, positioning the market to break a two-week losing streak.
Quick overview
- WTI crude futures rose over 2% towards the $60 mark, breaking a two-week losing streak due to rising supply risks from upcoming US sanctions on Russian crude.
- Lukoil has started cutting staff in response to the sanctions, and significant disruptions are expected in Russian oil exports as India and China halt purchases.
- Despite the recent gains, the International Energy Agency warns of an oil glut, predicting supply will exceed demand significantly this year and next.
- WTI is currently range-bound, with key resistance at $60.07 and support around $58.50, indicating traders should wait for confirmation before entering positions.
WTI crude futures climbed more than 2% toward the $60 mark on Friday, positioning the market to break a two-week losing streak. The gains were fueled by rising supply risks tied to upcoming US sanctions, which are expected to disrupt Russian crude flows starting November 21.
Lukoil PJSC has already begun cutting staff across its global trading operations ahead of the sanctions deadline, one of the earliest visible signs of market stress. Nearly a third of Russia’s seaborne exports could become stranded in tanker queues as rerouting, longer transit times, and slower unloading intensify disruptions. The situation has worsened as India and China temporarily suspended purchases of Russian oil, adding another layer of uncertainty to export flows.
Yet, bearish pressure hasn’t disappeared. The International Energy Agency (IEA) reiterated that an oil glut is building, forecasting that supply will exceed demand by 2.4 million barrels per day this year and 4 million next year, even as it projects consumption growth through 2050. OPEC also reported a surplus in the third quarter, while rising US output and another inventory build continue to anchor the market’s bearish undertone.
Technical Outlook: WTI Tries to Stabilize
WTI is attempting to base itself after a sharp decline into the mid-$58 range, with the 4-hour chart showing buyers stepping in around a key technical cluster. Price tagged the 50% Fibonacci retracement at $59.28, triggering a bullish rejection candle, often a signal that dip-buyers are still active.
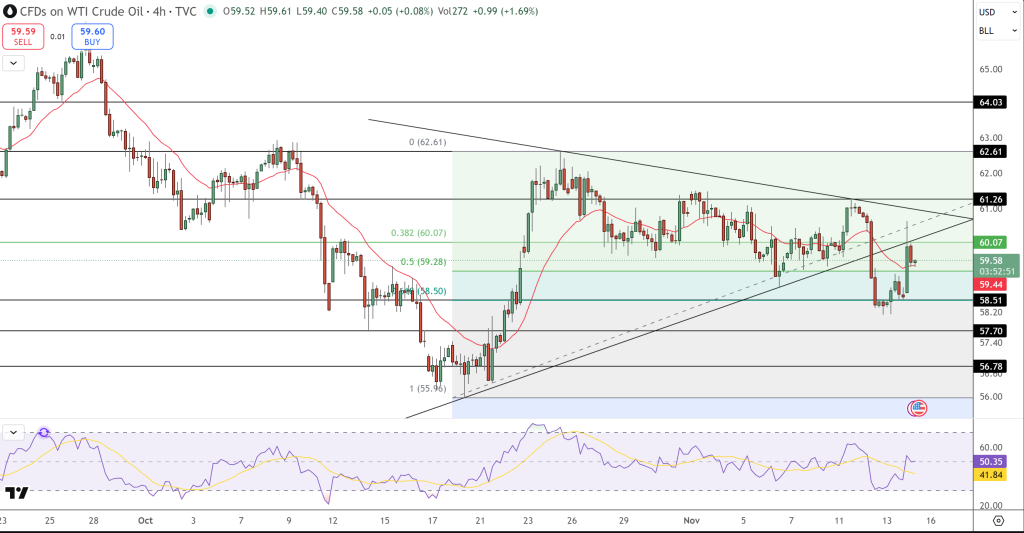
WTI now sits just beneath the descending trendline of a broad symmetrical triangle, aligned with the 38.2% Fib at $60.07, a level that’s repeatedly capped upside momentum. Earlier this week, a spinning-top candle near $61.26 highlighted hesitation at the upper boundary. Support remains firm around $58.50, where multiple long wicks created a soft “three-soldiers” rebound sequence, suggesting sellers lost conviction at those lows.
The RSI has reclaimed 50, supported by a minor bullish divergence against the recent lower low, a subtle sign that momentum could be shifting.
Still, WTI remains range-bound until price breaks decisively above $60.07–$61.26.
Trade Setup
- Entry: Buy on a confirmed break above $60.07, with a strong candle close above the descending trendline.
- Stop-Loss: Below $58.50, beneath recent higher-low support.
- Targets: $61.26 (T1) and $62.61 (T2).
This setup teaches new traders to wait for confirmation, not assumptions, before trading reversals or breakouts. Using Fibonacci levels, trendlines, and RSI signals helps keep the strategy structured and risk-defined.
- Check out our free forex signals
- Follow the top economic events on FX Leaders economic calendar
- Trade better, discover more Forex Trading Strategies
- Open a FREE Trading Account
- Read our latest reviews on: Avatrade, Exness, HFM and XM
Related Articles


Sidebar rates
Related Posts
