Synopsys (SNPS) Stock Faces Strong Volatility Amid Market Uncertainty
Quick overview
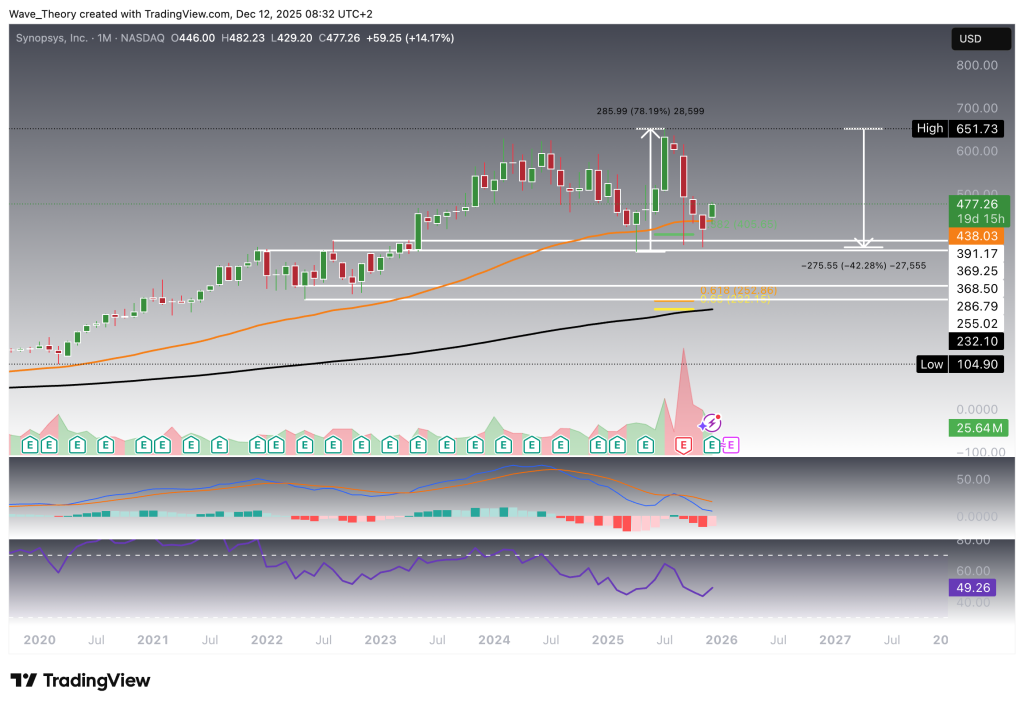
- Synopsys (SNPS) stock experienced significant volatility, rallying 78% before a 42% correction, highlighting instability in high-valuation tech stocks.
- The stock has rebounded from a critical support zone, breaking above the 50-month EMA, indicating potential medium-term strength.
- While long-term trends remain bullish, short-term charts show bearish signals, including death crosses and weakening momentum.
- Key resistance is at $481.4, with potential upside to $555, while failure to break this level could lead to a pullback towards $442.
The Synopsys (SNPS) stock price has seen a highly volatile year. After rallying sharply from $365 to $652 between April and July—a gain of roughly 78%—the stock reversed course and subsequently declined by about 42%, marking one of its steepest correction phases in recent years. This dramatic swing underscores the increasing instability in high-valuation tech names and sets the stage for a critical technical juncture ahead.
Synopsys (SNPS) Stock Bounced Off a Critical Support Zone
Following a sharp 42% correction, Synopsys rebounded decisively from the critical support area between $369 and $391, establishing a potential medium-term bottom. This bounce also allowed SNPS to break above the 50-month EMA at $483, reclaiming a key long-term dynamic resistance and signaling early signs of renewed strength.
From a structural perspective, the monthly EMAs still maintain a golden crossover, reaffirming a long-term bullish trend despite the recent volatility. Momentum indicators paint a more nuanced picture: while the MACD lines remain bearishly crossed, the MACD histogram has begun ticking bullishly higher today, indicating the first shift toward recovering momentum. Meanwhile, the RSI sits in neutral territory, offering no clear bullish or bearish signal but leaving ample room for further upside should momentum continue to improve.
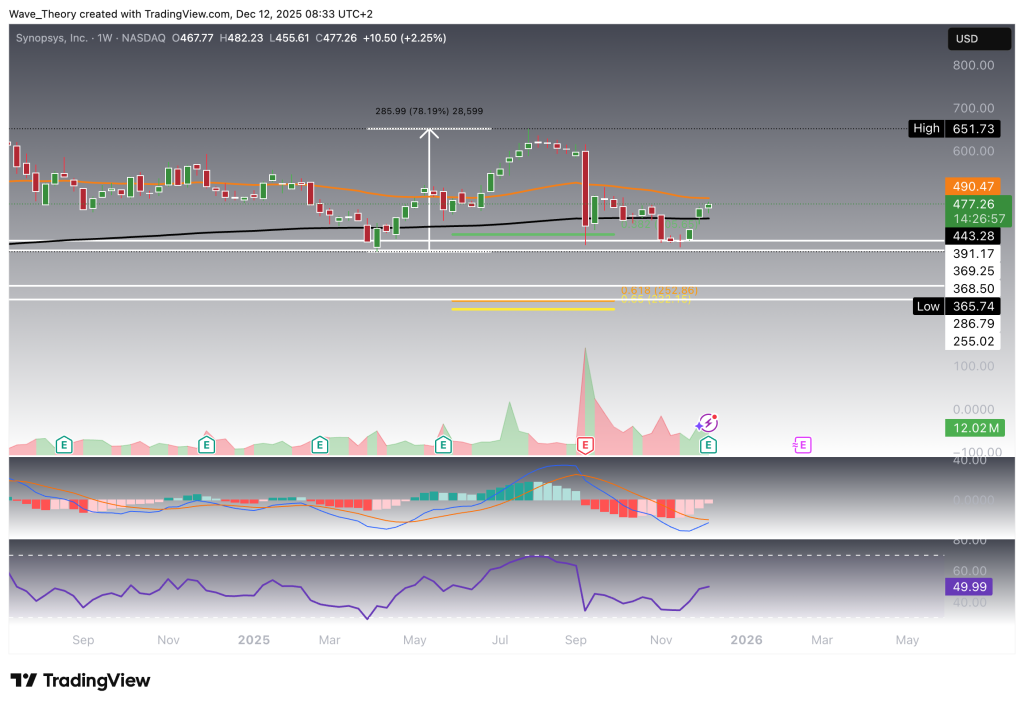
More Bullish Signals on the Weekly Chart
On the weekly chart, Synopsys (SNPS) continues to strengthen technically. The EMAs maintain a golden crossover, confirming the mid-term bullish trend. In addition, the MACD lines are on the verge of a bullish cross, supported by a MACD histogram that has been ticking higher for four consecutive weeks, indicating steadily improving momentum. Meanwhile, the RSI sits in neutral territory, giving neither bullish nor bearish signals and leaving room for further upside before overbought conditions become a concern.
In the immediate term, SNPS faces significant resistance at the 50-week EMA at $490.5. A confirmed breakout above this level would open the door to further bullish continuation. However, failure to break this resistance, followed by a bearish break of the current support zone between $369 and $391, would shift the outlook. In that case, the stock’s next major downside target becomes the critical support zone between $255 and $287, where the golden ratio (0.618 Fib) acts as a major technical confluence and potential reversal area.
Death Cross on the Daily Chart
On the daily chart, Synopsys has established a death cross, confirming a bearish short- to medium-term trend based on EMA structure. Momentum, however, remains somewhat mixed: while the MACD histogram continues to trend lower, signaling weakening momentum, the MACD lines themselves remain bullishly crossed, hinting at underlying strength. The RSI is hovering near overbought territory, yet provides no clear directional signal.
At the current stage, SNPS faces major resistance at the 0.382 Fibonacci level at $481.4. A decisive bullish breakout above this level could open the door for a 15.5% advance toward the golden ratio resistance at $555. Conversely, failure to clear the $481.4 resistance may trigger a pullback toward the 0.382 Fibonacci support at $442, where the 50-day EMA aligns as additional reinforcement. This scenario represents an approximate 8.3% downside risk—meaning that, at present, the upside potential outweighs the near-term downside.

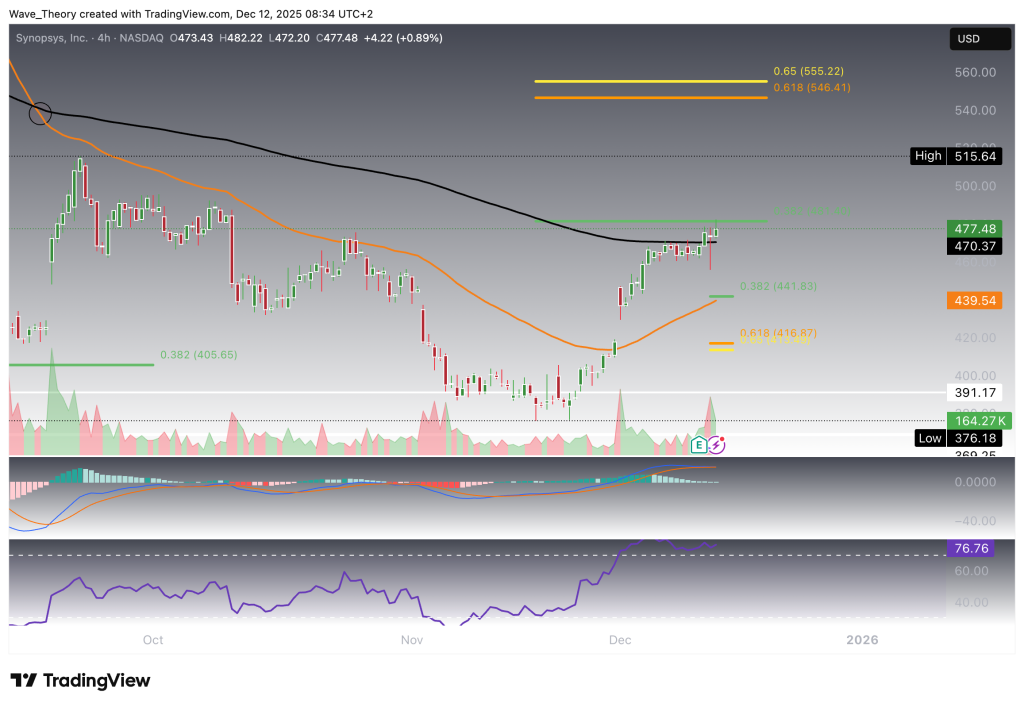
Similar Outlook on the 4H Chart
The 4H chart mirrors the bearish short-term structure seen on the daily timeframe. The EMAs have also formed a death cross, confirming the trend bearishly in the near term. In addition, the MACD histogram continues to trend lower, signaling weakening momentum, while the MACD lines are on the verge of a bearish crossover.
Meanwhile, the RSI trades in overbought territory, raising the risk of a potential bearish divergence forming—an early warning sign of a short-term reversal. If selling pressure emerges, SNPS could retrace toward the 0.382 Fibonacci support at roughly $442. Should this level fail to hold, the stock’s next major support lies at the golden ratio level around $415, which represents a structurally significant downside target.
Summary of the Synopsys (SNPS) Technical Outlook — Key Levels to Watch
Synopsys (SNPS) has shown high volatility, recovering sharply after a 42% correction and bouncing from the key $369–$391 support zone. The long-term and mid-term trends remain bullish, supported by golden crossovers on both the monthly and weekly charts, with momentum improving as the MACD histograms turn bullish. However, short-term charts show weakness: the daily and 4H timeframes feature death crosses, declining MACD histograms, and overbought RSI readings, signaling potential near-term downside.
For now, SNPS faces major resistance at $481.4 (0.382 Fib). A bullish breakout targets the golden ratio resistance at $555, representing ~15.5% upside. In contrast, rejection at $481.4 opens a pullback toward $442 (0.382 Fib support). If this support fails, the next downside targets lie at $415 (golden ratio) and, in an extended decline, the $255–$287 support cluster.
Key Levels
-
Immediate Resistance: $481.4 (0.382 Fib), then $555 (Golden Ratio)
-
Immediate Support: $442 (0.382 Fib), then $415 (Golden Ratio)
-
Major Support Zones: $369–$391 | $255–$287
-
Trend Signals:
-
Bullish: Monthly & weekly golden crossovers, rising MACD histograms
-
Bearish: Daily & 4H death crosses, weakening momentum, overbought RSI
-
Overall, upside potential currently outweighs downside risk, but short-term volatility remains elevated.
- Check out our free forex signals
- Follow the top economic events on FX Leaders economic calendar
- Trade better, discover more Forex Trading Strategies
- Open a FREE Trading Account
- Read our latest reviews on: Avatrade, Exness, HFM and XM
Related Articles
Sidebar rates
