Ethereum Battles Critical $3,100 Support as Technical Indicators Flash Mixed Signals
In spite of increasing technical pressure, Ethereum (ETH) has held constant over the last day, trading at about $3,100. With short-term bear
Quick overview
- Ethereum has maintained a price of around $3,100 despite short-term bearish signals and a potential long-term bullish trend aiming for $10,000.
- The cryptocurrency faced a rejection at the 50-day EMA, leading to a 7.62% drop and raising concerns about further declines if it falls below the $3,017 support level.
- Short-term resistance is noted at $3,200, with a need for bulls to reclaim this level to initiate a potential upward movement toward $3,400 and beyond.
- A Wyckoff accumulation pattern suggests that if Ethereum can hold above $3,750, it may enter a growth phase targeting $10,000.
In spite of increasing technical pressure, Ethereum ETH/USD has held constant over the last day, trading at about $3,100. With short-term bearish indications vying with a longer-term bullish accumulation structure that might push prices toward $10,000, the second-largest cryptocurrency by market capitalization is at a turning point.
Short-Term Bearish Pressure Mounts After 50-Day EMA Rejection
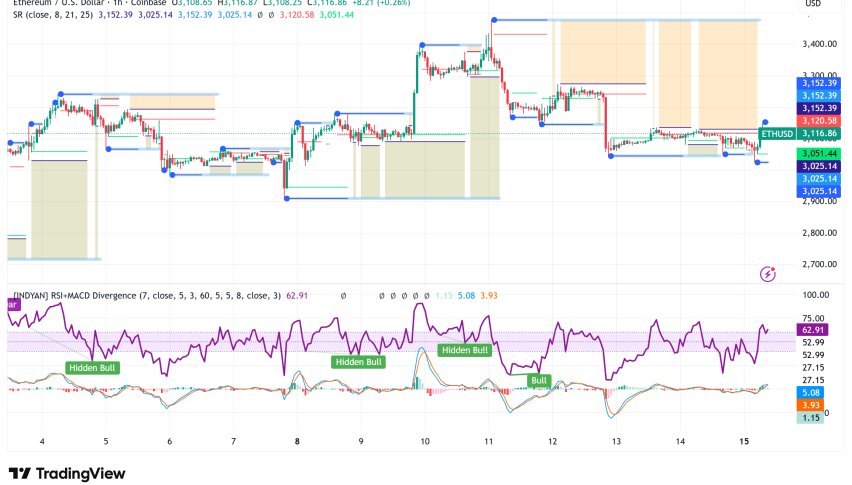
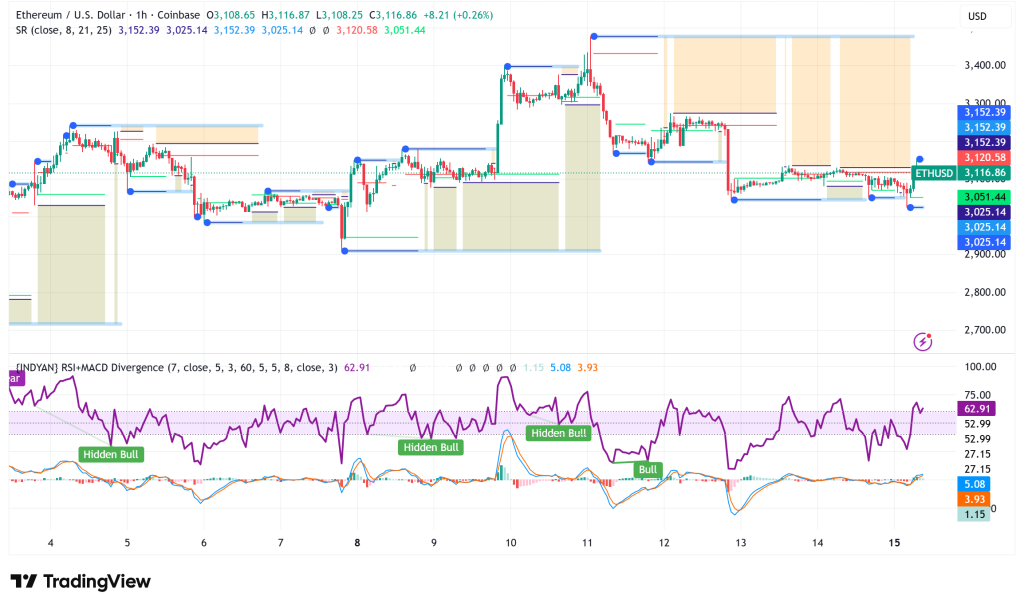
After failing to close above the 50-day Exponential Moving Average (EMA) around $3,280 on Wednesday, Ethereum’s recent price movement has become cautious. Due to this rejection, ETH saw a precipitous 7.62% drop through Sunday, reaching its current value of about $3,100.
There are warning indications starting to appear on the daily technical indicators. For the first time in recent sessions, the Relative Strength Index (RSI), a sign of possible bearish momentum building, has dropped to 49 and below the neutral 50 mark. In the meantime, the Moving Average Convergence Divergence (MACD) lines are converging, indicating the possibility of an impending bearish crossover that would support the pessimistic short-term picture.
The $3,017 daily support level represents Ethereum’s immediate risk. An extended correction toward the next significant support zone at $2,749, or a another 11% decline from current levels, might be triggered with a verified close below this threshold.
Hourly Chart Shows Consolidation with Resistance Overhead
Ethereum’s price structure seems just as unstable on shorter timescales. ETH has been making an effort to rebound after falling as low as $3,026, but it is encountering strong opposition. The hourly chart shows a negative trend line with resistance at $3,175; the price is still below the 100-hourly Simple Moving Average and the $3,200 mark.
Another layer of resistance is provided by the 50% Fibonacci retracement level of the most recent slide from $3,273 to $3,026; it is located close to $3,150. To change momentum, bulls will need to firmly regain the $3,200 level. This might pave the way for $3,250 and even $3,320. If this resistance is not overcome, there may be another drop toward $3,080, with significant support around $3,050 and $3,000 protecting against worse losses.
Interestingly, despite the difficult price action, the hourly RSI has risen over 50, indicating some underlying strength, and the hourly MACD is displaying momentum in the bullish zone.
Long-Term Wyckoff Pattern Points to Explosive $10,000 Target
Crypto expert Merlijn The Trader has noticed what he calls a “Wyckoff masterclass” unfolding on Ethereum’s 2-day chart throughout 2025, which stands in stark contrast to the short-term bearish setup. This research shows that after a decline below $1,500 earlier this year and a selling climax at $4,946, ETH has been going through a textbook Wyckoff accumulation phase.
Phase D of the Wyckoff structure, which is the last accumulation stage before to a possible breakout, is represented by the current consolidation between $3,050 and $3,400. Ethereum would reach Phase E, which is marked by a persistent vertical markup and has the potential to drastically raise prices, if the pattern completes as expected.
According to the forecast, there will be an initial push over $5,000 into new all-time highs, followed by a pullback to create a backup support level at about $3,750. Ethereum may start a growth phase aiming at $10,000 and above if this level holds during the retest.
Ethereum Price Outlook: Critical Decision Point Ahead
Ethereum is at a turning point. As long as ETH stays below $3,200 and the 50-day EMA stays at $3,280, bears will continue to hold sway in the short term. Selling pressure would probably increase toward $2,749 if there was a break below $3,017.
The route would clear toward $3,400 and possibly higher levels in line with the bullish Wyckoff accumulation theory, though, if bulls could regain $3,280 and turn it into support. For traders, the $3,000–$3,100 range is a crucial battleground that will decide whether Ethereum starts the next leg of its longer-term rally toward five figures or continues its fall.
- Check out our free forex signals
- Follow the top economic events on FX Leaders economic calendar
- Trade better, discover more Forex Trading Strategies
- Open a FREE Trading Account
- Read our latest reviews on: Avatrade, Exness, HFM and XM