Bank of America “All In” on XRP? ETF Holdings Revealed as Price Tests Critical $1.58 Support
There is a clear split in the XRP market. As the price drops toward a key support level at $1.58, large institutions are steadily...
Quick overview
- The XRP market is experiencing a split, with prices nearing a key support level of $1.58 while institutional interest, particularly from Bank of America, is increasing.
- Bank of America recently disclosed holdings in the Volatility Shares XRP ETF, indicating a strategic move to gain regulated exposure to XRP.
- Despite XRP's price drop, US-listed spot XRP ETFs are seeing steady inflows, suggesting that experienced investors are capitalizing on lower prices.
- The technical analysis shows XRP is at a critical juncture, with potential for a relief rally if support holds, but risks a significant drop if it falls below $1.50.
There is a clear split in the XRP market. As the price drops toward a key support level at $1.58, large institutions are steadily increasing their exposure. Bank of America recently disclosed holdings in XRP ETFs, showing that Wall Street remains interested even as technical trends look bearish.
Institutional Shift: Bank of America Steps In
Bank of America’s latest SEC filing on February 3 shows it holds 13,000 shares in the Volatility Shares XRP ETF, worth about $224,640. While this is a small amount for such a large bank, the move is strategically significant.
- Strategic Exposure: This purchase marks a deliberate step by BofA to gain regulated exposure to the asset, moving beyond mere partnership discussions to actual balance sheet allocation.
- “All In” Sentiment: The move aligns with recent comments from Ripple President Monica Long, who confirmed that BofA’s leadership has expressed being “all in on XRP,” particularly regarding cross-border payments and the upcoming RLUSD stablecoin.
- Client Advisories: BofA is reportedly recommending crypto allocations of up to 4% for wealth management clients, further legitimizing the asset class.
ETF Inflows Continue Despite Price Drop
Bank of America isn’t the only institution interested. Even though XRP is trading below $1.60, US-listed spot XRP ETFs are seeing steady inflows, which suggests that experienced investors are buying while prices are low.
- Total Daily Inflows (Feb 2): $19.46 million
- Top Performers: Franklin XRPZ led with $12.13 million, followed by the Bitwise XRP ETF with $4.82 million.
However, not all signs are positive. DCG International Investments Ltd reportedly sold more than 19,000 GXRP shares, showing a split between investors who are holding for the long term and insiders who are selling during the downturn.
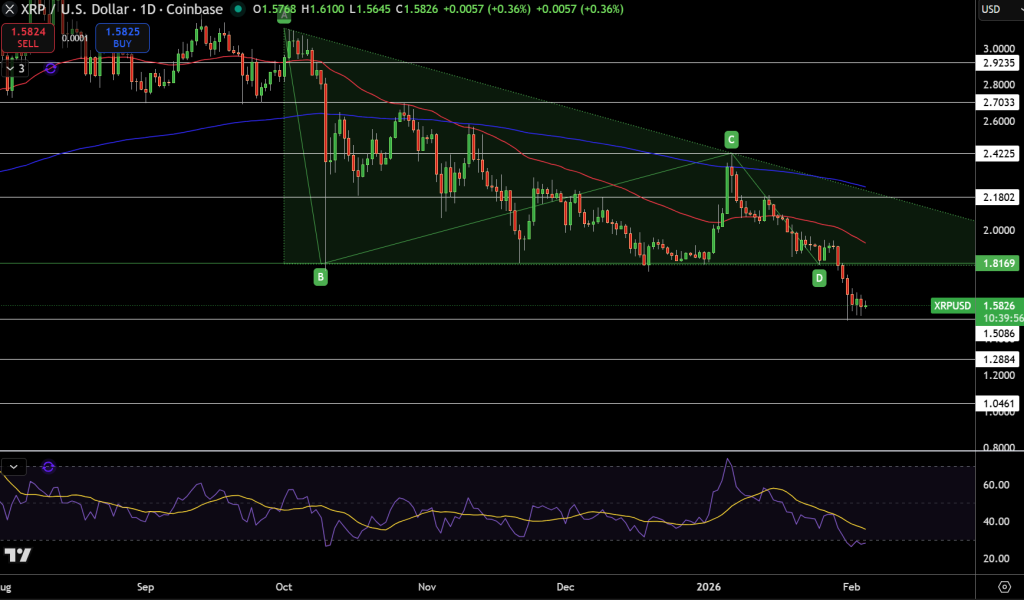
XRP/USD Technical Analysis: The “Make or Break” Wedge
As institutions continue to buy, the technical chart shows a risky setup. XRP is stuck in a Descending Broadening Wedge, a pattern that often leads to big price swings.
XRP is now trading at $1.58, right on the lower support line of the wedge. This is a key level for buyers. If the price closes below $1.50 for a day, the wedge pattern would break, and the price could quickly fall toward the next support at $1.25.
Bearish Momentum and Oversold Signals
- Moving Averages: The price remains well below the 200-day EMA (around $2.30) and is being suppressed by the 50-day EMA ($1.90), confirming the dominant downtrend.
- RSI Divergence: The Relative Strength Index (RSI) is hovering near 30-40. This “oversold” reading, combined with stable support, often precedes a relief bounce.
Data from the derivatives market shows caution. Total XRP futures open interest fell by 4% to $2.65 billion in the past 24 hours, which means that traders using leverage are closing their positions instead of betting on a price reversal.
The Forecast: Breakout or Breakdown?
Right now, the market is stuck between negative technical signals and positive fundamental news.
- Bullish Scenario: If the $1.58 support holds and institutional inflows continue, XRP could stage a relief rally targeting the upper channel resistance at $1.81 – $1.90.
- Bearish Scenario: If macro weakness persists and the $1.50 floor breaks, the institutional “buy wall” may not be enough to stop a flush to $1.25.
In summary, Bank of America’s disclosure offers some fundamental support, but the technical charts suggest caution. Traders should look for a strong bounce from $1.58 with high trading volume to confirm that institutional investors are defending the price.
- Check out our free forex signals
- Follow the top economic events on FX Leaders economic calendar
- Trade better, discover more Forex Trading Strategies
- Open a FREE Trading Account
- Read our latest reviews on: Avatrade, Exness, HFM and XM