WTI Crude Oil Price Prediction: $73 Target Exposed as Trump-Iran Peace Pact Unwinds Risk Premium
WTI Crude Oil Price Prediction: Crude slides to $78.29 as a sudden Trump-Iran peace pact triggers a structural symmetrical triangle technical breakdown.

Quick overview
- WTI crude oil prices fell to $78.29 per barrel, marking a significant decline due to a historic peace deal between the U.S. and Iran.
- The peace accord has alleviated supply-disruption fears, leading to aggressive liquidation of long-duration derivatives positions in energy trading.
- OPEC+ plans to increase production quotas by 188,000 barrels per day in July, coinciding with record U.S. shale output.
- Technical analysis indicates a bearish breakdown for WTI crude, suggesting further price declines in the second half of 2026.
The energy complex has been violently restructured, eliminating its geopolitical buffers in real-time. Tuesday, June 16, 2026 saw WTI crude oil continue its downward streak for multiple days, falling to trade near $78.29 per barrel. Energy trading desks are aggressively dumping long-duration derivatives positions, liquidating length because a historic diplomatic success from Washington is fundamentally resetting energy markets away from supply-disruption anxieties toward a heavily oversupplied cyclical landscape.
The primary driver behind the massive selloff of crude prices this week comes from President Donald J. Trump’s confirmation that a peace deal was signed in which both sides will abide by a comprehensive memorandum of understanding to end hostilities in the Middle East with Iran. The surprise peace accord prevented military escalation and provides a clear, verifiable path to Tehran removing its trade blockades. For the energy market, this means maritime vessels are no longer barred from navigating through the Hormuz Strait at the heart of the Middle East where nearly 20 percent of global oil supply flows each day. With the geopolitical discount disappearing, oil prices were cut by roughly 5 percent in one session and retrace back to the lowest levels in over three months since March 4.
OPEC+ Adds Supply On Top of the Massive 6.5% PPI Surge
The re-integration of oil supplies from the Middle East has arrived when the physical commodity market is already in a highly vulnerable moment.
-
The OPEC+ July Quota Increase: A group of 7 nations from the organization voted on June 7 to increase production quotas by an additional 188,000 barrels per day effective in July as they exit a voluntary production cut after the United Arab Emirates defected from the organization.
-
Record Non-OPEC Output: U.S. domestic shale production levels will remain at or near record highs over the summer as additional output from countries including Guyana, Brazil, and Canada continue to increase over the years.
-
The “Hawkish Warsh” Policy Vise: Today marks the first Federal Reserve two-day meeting under the chairmanship of newly sworn-in Fed Chair Kevin Warsh. After the May Producer Price Index came in a blistering 6.5% higher than expected from the year, Warsh is likely to reaffirm an aggressive monetary tightening stance aimed at slowing down rising producer costs. A hawkish Fed stance supports the U.S. Dollar Index, acting as a headwind against industrial commodities.
WTI Crude Oil Technical Analysis: Symmetrical Triangle Breakdown Extends Lower
WTI Crude Oil Technical Analysis: Symmetrical Triangle Breakdown Extends Lower. Turning our attention from the rapidly evolving political news cycle to the 4-hour chart, WTI has completed a multi-week symmetrical compression pattern on strong volume with a classic, high-certainty bearish breakdown, and ceded absolute tactical control of the situation to short sellers.
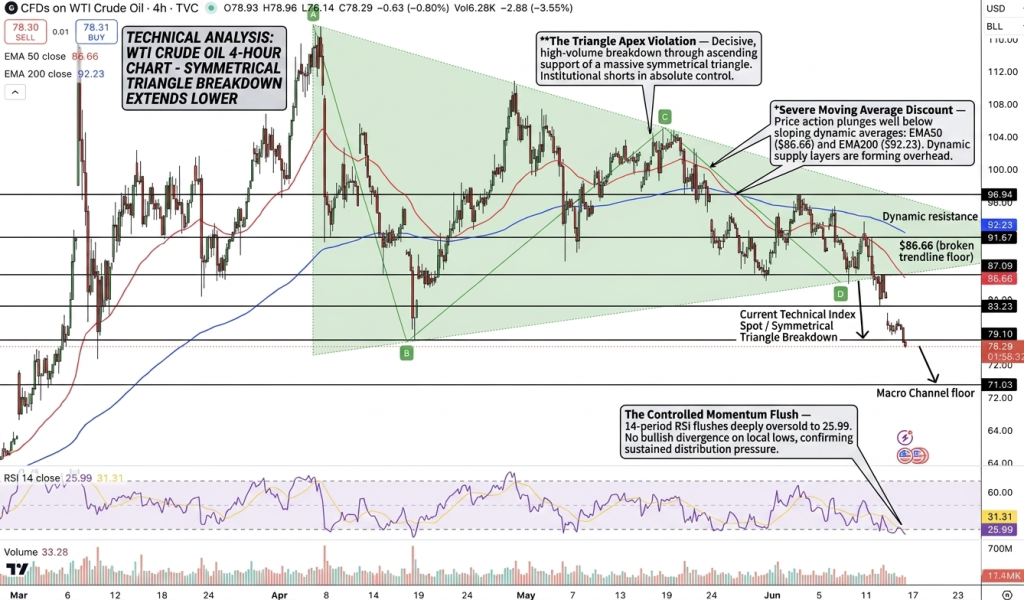
Triangle Apex Violation
WTI ($78.29) has broken the lower, ascending support trendline of a broad symmetrical triangle pattern (points A-B-C-D) in a high-volume event with 100% intermediate-term bearish implications. Price Action has fallen far below both its EMA50 ($86.66) and its EMA200 ($92.23) after the price action was rejected off the upper green zone ($92 to $96), and both averages are angled heavily downward as overhead supply, and the 14-period RSI has dropped into a very deep oversold level (25.99) to signal the short-covering risk, but with no immediate bullish divergences visible at local price lows as the short pressure from big money continues to dominate.
14-period RSI dropped into a very deep oversold level (25.99) to warn of short-covering risks but with no immediate bullish divergences at local price lows as the short pressure from big money continues to dominate.
Tactical Short Execution
A trend continuation strategy can be set up by taking short positions on short-term price action that pulls back to any failed tests of the now-broken horizontal support resistance zone at $78.00 to $79.00 with stop-losses set at a very tight level just above the local consolidation high at $82.00 and taking target at the measured triangle extension move of the breakdown to $73.62 and at the macro channel support at $71.03.
As crude oil makes the violent return to its long-term cyclical and fundamental reality, there will certainly be short-term news headlines if there are any delays or violations with the Trump-Iran verification and compliance, but with a large 188,000 bpd OPEC+ production bump coming in the near future, record domestic shale output volumes, and a very well-defined and high-probability technical breakdown, WTI crude oil is very likely headed further lower in H2 2026.
- Check out our free forex signals
- Follow the top economic events on FX Leaders economic calendar
- Trade better, discover more Forex Trading Strategies
- Open a FREE Trading Account
- Read our latest reviews on: Avatrade, Exness, HFM and XM
Related Articles

Sidebar rates
Related Posts
