Gold’s Death Cross Confirmed: Downtrend Signal Appears Through Relief Rally
The broader picture reveals that gold is coming off its worst quarterly decline since 2013, down roughly 14% in Q2,

Quick overview
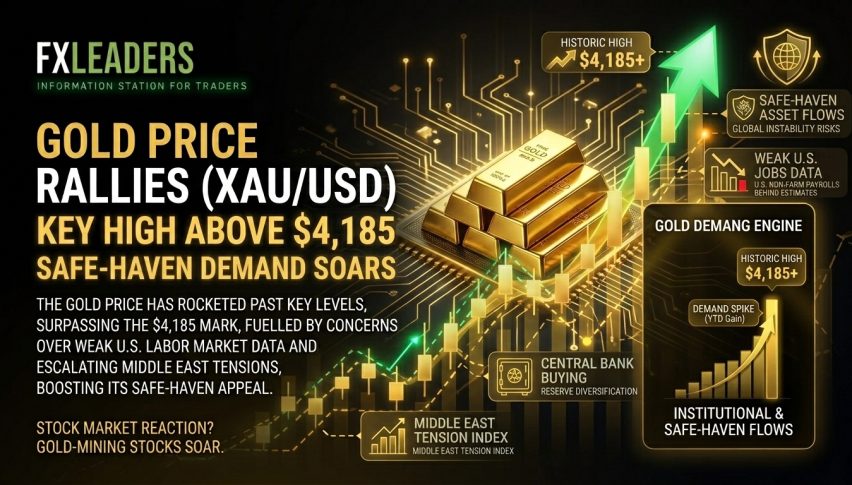
- Gold reached a peak of $4,171.15 per troy ounce but is coming off its worst quarterly decline since 2013, down about 14% in Q2.
- A 'Death Cross' was confirmed on June 29, indicating severe short-term bearish momentum despite a recent 2.5% rebound.
- The recent spike in gold prices was triggered by disappointing US job data, which alleviated fears of aggressive interest rate hikes.
- Gold has experienced a significant 28% drop from its January 2026 peak, with historical patterns suggesting further declines may follow the Death Cross.
Gold experienced a highly volatile stretch, hitting $4,171.15 per troy ounce. The broader picture reveals that gold is coming off its worst quarterly decline since 2013, down roughly 14% in Q2, while it has rebounded roughly 2.5% over the last 48 hours,

A “Death Cross” (50-day moving average dropping below the 200-day moving average) triggered late last month, signaling severe short-term bearish momentum despite the current relief rally.
.The confirmation of the Death Cross on June 29 —where the 50-day simple moving average crossed cleanly below the 200-day moving average—has thrown a major technical wet blanket over the market. Even with the recent employment-data relief rally pushing spot gold back up toward $4,170, the algorithmic and chart-driven momentum remains heavily skewed to the downside.
The sharp 2.5% spike over the last 48 hours was directly triggered by the US June non-farm payrolls data, which showed the economy added a weak 57,000 jobs—far below the expected 114,000. This immediately cooled fears of aggressive Federal Reserve interest rate hikes, giving the non-yielding metal a major breathing room.
Before this week’s rebound, gold crashed nearly 29% from its all-time January high of over $5,600/oz. The massive sell-off was fueled by structural shifts: a roaring tech/AI stock rally that sucked liquidity out of defensive assets, a relentlessly strong US Dollar, and hawkish Fed commentary keeping real yields elevated.
As spot prices dipped below the psychologically critical $4,000 mark in late June, physical buyers in major retail markets like India stepped in heavily to capitalize on the discounts, helping establish a temporary price floor.
Gold is coming off a staggering 28% drop from its January 2026 peak of $5,589, moving directly out of a heavy downtrend. Historically, when a death cross hits a market already locked in a steep downward trajectory, like in 2013 or July 2022, it often signals that a faster, deeper fall is yet to come, rather than a bottoming-out phase.
- Check out our free forex signals
- Follow the top economic events on FX Leaders economic calendar
- Trade better, discover more Forex Trading Strategies
- Open a FREE Trading Account
- Read our latest reviews on: Avatrade, Exness, HFM and XM

Related Articles

Sidebar rates

Related Posts
 Save
Save