Gold sideways channel breakout – Is it going after $1,192?
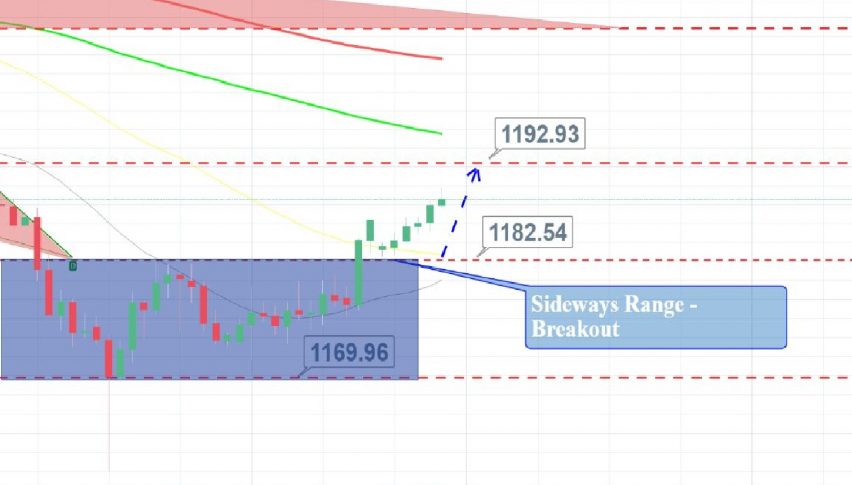
On the 2 hour timeframe, gold has violated the sideways trading range of $1,169 - $1,182. You can also see a bullish crossover on the 50...
•
Last updated: Monday, August 20, 2018
What’s up, traders.
On the 2 hour timeframe, gold has violated the sideways trading range of $1,169 – $1,182. You can also see a bullish crossover on the 50 periods moving average which earlier provided a solid resistance near $1,183.
[fxml_m0re_topics]
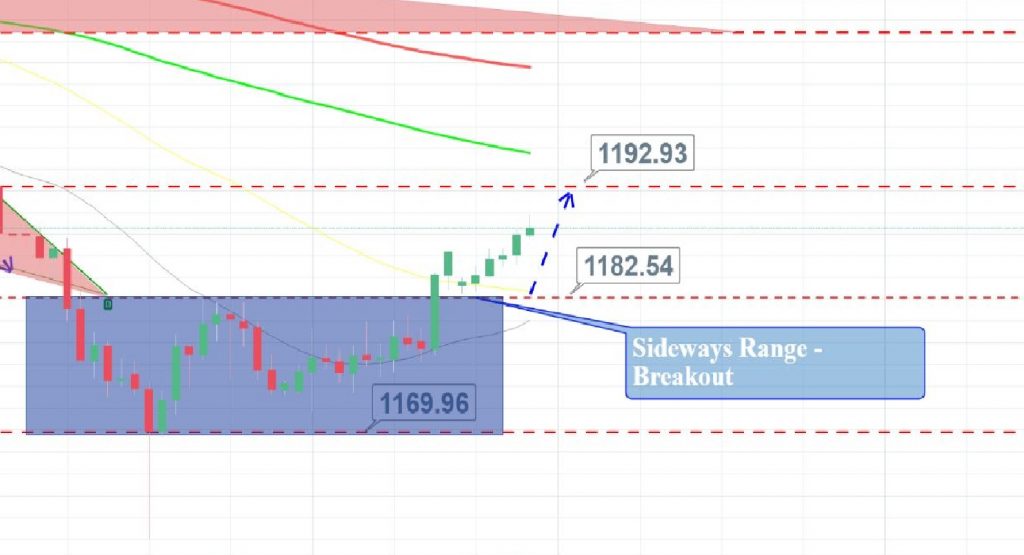
Gold – 2 Hour Chart
In order to encash this breakout, we just shared a forex trading signal to open a buying position near $1187.52 with a stop loss below $1,184 and take profit at $1,190. Anyway, gold is very likely to go after $1,192 and then $1,196.
Do check out FX Leaders weekly support and resistance levels for gold at Aug 20 – 24: Weekly Technical Levels for Gold & WTI Crude Oil. Good luck!
- Check out our free forex signals
- Follow the top economic events on FX Leaders economic calendar
- Trade better, discover more Forex Trading Strategies
- Open a FREE Trading Account
- Read our latest reviews on: Avatrade, Exness, HFM and XM
ABOUT THE AUTHOR
See More
Arslan Butt
Lead Markets Analyst – Multi-Asset (FX, Commodities, Crypto)
Arslan Butt serves as the Lead Commodities and Indices Analyst, bringing a wealth of expertise to the field. With an MBA in Behavioral Finance and active progress towards a Ph.D., Arslan possesses a deep understanding of market dynamics.
His professional journey includes a significant role as a senior analyst at a leading brokerage firm, complementing his extensive experience as a market analyst and day trader. Adept in educating others, Arslan has a commendable track record as an instructor and public speaker.
His incisive analyses, particularly within the realms of cryptocurrency and forex markets, are showcased across esteemed financial publications such as ForexCrunch, InsideBitcoins, and EconomyWatch, solidifying his reputation in the financial community.
Related Articles

Sidebar rates
Related Posts
