Ripple XRP, Solana SOL Stall at the 200 SMA Before the Next Assault?
Solana SOL and Ripple XRP cryptos hesitate at the 200 daily SMA
The crypto market was bearish for several months since it reversed down in November. Although, the bearish period seems to have ended since cryptocurrencies have been making gains for around a month now. Solana (SOL) and Ripple (XRP) have gained more than 80% from January’s lows, but they have stopped the rally at the 200 SMA on the daily chart. This will be the real test for them. If these crypto tokens push above this moving average, then they will have resumed the uptrend and be considered bullish again.
Ripple Daily Chart – The 200 SMA Keeping the Lid On For XRP

XRP awaits more victories against the SEC
The lawsuit from the SEC (Securities and Exchange Commission) was keeping Ripple (XRP) down last year, leaving it behind the rest of the crypto market, as most cryptocurrencies kept making new highs until November. The lawsuit has kept investors waiting to see how it would end up. But now, it seems that it might be heading toward a settlement as comments from previous weeks suggested. In recent days we heard that Ripple is getting extra time to respond to SEC.
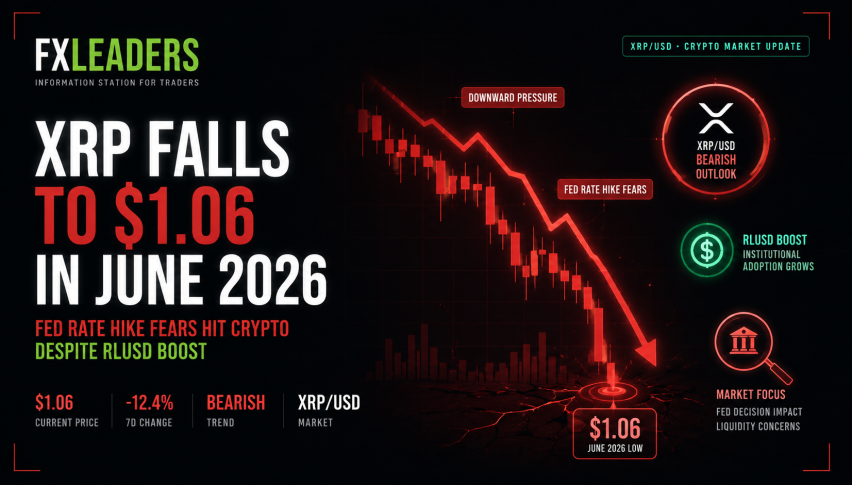
Besides that, the investment banking division of Goldman Sachs recently mentioned Ripple’s network as an opportunity for making payments. In January XRP declined to $0.55 but at the beginning of February we saw a jump which sent XRP above $0.90 and since then the pressure has been to the upside for this cryptocurrency. But, buyers are finding it hard to push above the 200 SMA, so until then XEP remains bearish. If it moves above the 200 SMA and the $1 level, then that would be considered bullish.
Solana Daily Chart – The 200 SMA Rejects in the First Attempt

The resistance is turning into support for Solana
Solana reversed at $260 in November and the decline was picking up pace until January when it fell to $80. But the resistance and support zone at that level stopped the sellers on several occasions and eventually the reversal higher took place. Although, that was official only after the break of the 50 SMA (yellow) which had been acting as resistance until March, pushing the highs lower during retraces.
Buyers kept pushing SOL/USD higher and broke the 100 SMA (green) as well as the resistance zone around $130. But, the 200 SMA (purple) which comes at $143 stopped buyers, although the retreat hasn’t been too harsh so far, so the selling pressure seems weak, which means that the buying will resume soon and Solana will push above the 200 SMA.
Solana Token SOL Daily Chart
- Check out our free forex signals
- Follow the top economic events on FX Leaders economic calendar
- Trade better, discover more Forex Trading Strategies
- Open a FREE Trading Account
- Read our latest reviews on: Avatrade, Exness, HFM and XM
Related Articles


Sidebar rates
Related Posts
