Forex Signals Brief June 25: CAD Traders Waiting the Canadian CPI
Today the CPI inflation from Canada will highlight the day and decide the the fate of the CAD after BOC's Macklem comments yesterday

Yesterday’s focus was on the weakness observed in cryptocurrencies and the US dollar, which some attributed to speculation about potential yen intervention. Despite an early uptick, the dollar struggled against major currencies like the euro, pound, and Canadian dollar throughout the day. This occurred even as Treasury yields declined.
The overall risk sentiment in the market is currently intriguing, highlighted by Nvidia’s 15% decline and Bitcoin slipping below the $60,000 mark for the first time in about two months. This downturn raises concerns for risk assets broadly, although the S&P 500 managed a modest decline of only 0.3%. However, energy markets provided some support, with oil prices recovering from earlier losses to rise slightly over 1%.
Today’s Market Expectations
The Canadian CPI year-over-year (Y/Y) is forecasted at 2.6%, slightly down from 2.7% previously, while the month-over-month (M/M) figure is projected at 0.3%, down from the previous 0.5%. The Trimmed Mean CPI Y/Y is expected at 2.8%, a slight decrease from 2.9% last year, and the Median CPI Y/Y is anticipated to remain steady at 2.6%. The latest report indicated that underlying inflation indicators have returned to the Bank of Canada’s 1-3% target range, enabling the central bank to implement its first rate cut. The market sees a 67% chance of another rate cut in July, contingent upon this week’s CPI report.
The consumer confidence in the United States has been weakening in recent months, and the Conference Board confidence indicator is expected to fall 2 points in June to 100 points from the previous reading of 102. The latest report indicates an uptick in confidence following three consecutive months of decline. According to the Chief Economist of the Conference Board, “the strong labor market continues to support consumers’ positive assessment of the current situation.” Looking forward, fewer consumers anticipate a deterioration in future business conditions, job availability, and income. The overall confidence index remains within a relatively narrow range that has persisted for over two years. Given recent data on US Jobless Claims, particular attention will be paid to the Present Situation Index, as it typically serves as a leading indicator of the unemployment rate.
Yesterday the volatility was low, except in Bitcoin and we didn’t open too many trading signals. We ended up with four closed forex signals at the end of the day, three of which were winning trades and one was a losing trade, since we were short of EUR/USD form Friday, following the decline below 1.07, but the pullback higher was stronger yesterday.
Selling Gold After the Strong Rejection Last Week
Gold saw a bullish breakout on Thursday, surpassing the 50-day Simple Moving Average (SMA) (yellow). Despite this initial surge, buyers struggled to sustain the price above the 50 SMA, resulting in a shift in momentum. By the end of the session, gold retraced approximately $50 from its peak. The market sentiment remains bearish as evidenced by yesterday’s tepid gains, prompting our decision to initiate a sell signal on gold.
XAU/USD – Daily chart
AUD/USD Remains Confined Within the Range
The AUD/USD pair has maintained a stable range, oscillating between the 100-day Simple Moving Average (SMA) as support at the lower boundary and the 200 SMA (purple) as resistance at the upper boundary. Earlier this week, AUD/USD tested the lower end of its tight trading range between 0.6575 and 0.66896 before attempting to breach the upper limit. Traders have been capitalizing on this range by buying near the 100 SMA during downturns and selling near the 200 SMA during upswings. The primary objective remains to break out of this established range. Once the price surpasses these boundaries, a significant move in the direction of the breakout is anticipated. Until such a breakout occurs, the strategy involves trading within the confines of the current range, as indicated by the 100-day and 200-day moving averages on the daily chart.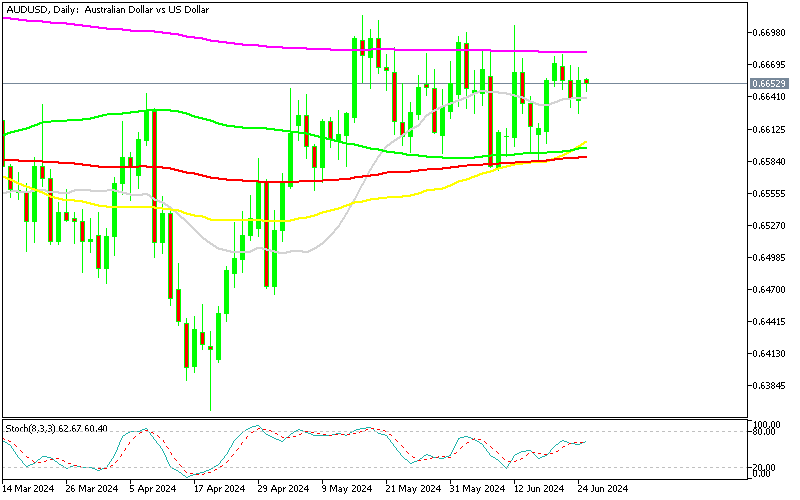
AUD/USD – Daily Chart
Cryptocurrency Update
Bitcoin Slips Below $65,o00
Bitcoin has been on a downward trajectory for over two weeks, currently hovering around $60,000. We are deliberating whether to initiate a purchase today or await a potential further decline. Given the accelerated slide observed today, entering the Bitcoin market on the long side at this moment feels precarious, akin to catching a falling knife. Therefore, our approach is to closely monitor price action to discern if a bottom is forming here. Should the current levels not hold, our attention will shift to the early May low around $57,000 as a potential entry point for long positions. Alternatively, if Bitcoin continues to decline, the $50,000 level presents itself as a favorable area to consider initiating long positions.
BTC/USD – Daily chart
Ethereum Falls Below the 100 Daily SMA
Since the launch of its ETF, Ethereum (ETH) has experienced volatility, reaching a high of $3,832.50. This surge was driven by growing market confidence after the SEC’s favorable stance on spot Ether ETFs. Ethereum’s price has risen by 25% from its previous highs, reflecting strong investor interest and market demand. Despite this upward trend, Ethereum recently dipped below $3,500.The 50-day Simple Moving Average (yellow) held as support a couple of times, but it gave up over the weekend, while yesterday sellers pushed below the 100 SMA (green) as the selling accelerated.
ETH/USD – Daily chart
- Check out our free forex signals
- Follow the top economic events on FX Leaders economic calendar
- Trade better, discover more Forex Trading Strategies
- Open a FREE Trading Account
- Read our latest reviews on: Avatrade, Exness, HFM and XM

Related Articles



Sidebar rates

Related Posts
 Save
Save