Shiba Inu (SHIB) Eyes $0.00001590 Breakout After $33M Whale Transfers
Shiba Inu (SHIB) #16 by market cap has seen a cluster of transactions over the past 24 hours with multiple transfers of exactly $33,333,333.

Quick overview
- Shiba Inu (SHIB) has experienced a series of $33,333,333 transactions, sparking speculation about potential whale activity or automated trading.
- Currently trading at $0.00001418, SHIB is down 1.93% with a market cap of approximately $8.37 billion and a 24-hour volume of $305 million.
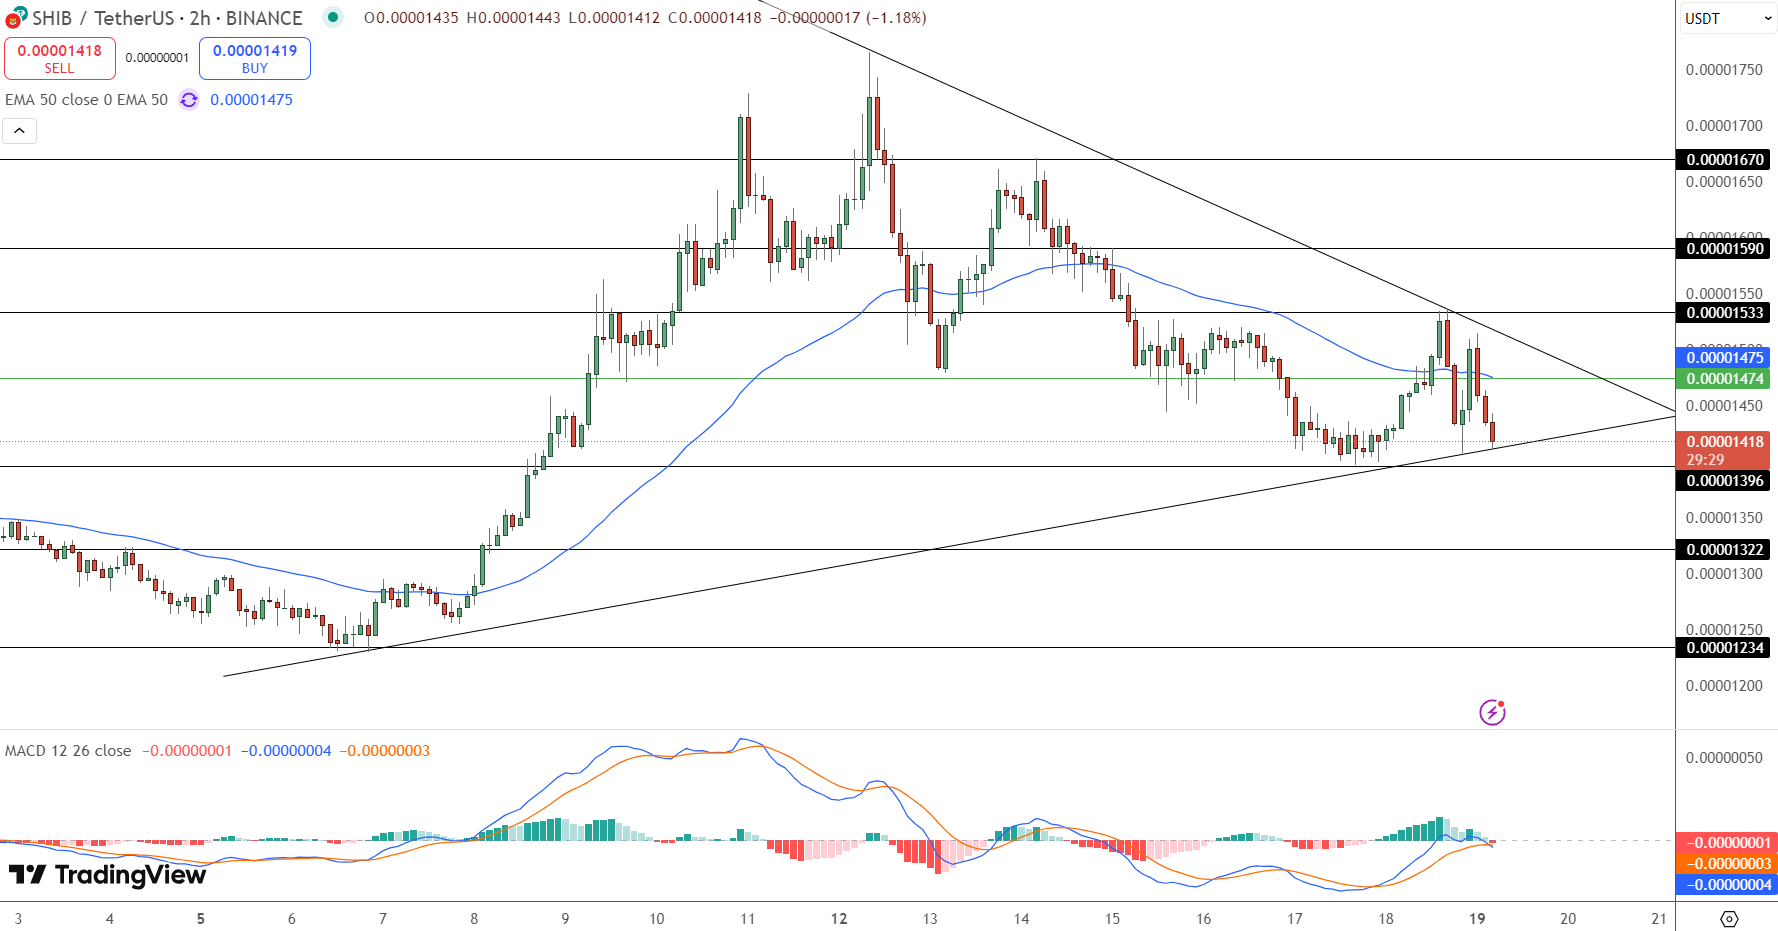
- Technically, SHIB is forming a symmetrical triangle, indicating a potential breakout as it is constrained between resistance at $0.00001533 and support at $0.00001396.
- Traders should monitor for a breakout above $0.00001475 for bullish momentum or a drop below $0.00001396 for further downside.
Shiba Inu (SHIB) #16 by market cap has seen a cluster of transactions over the past 24 hours with multiple transfers of exactly $33,333,333. The symmetry of these numbers has got traders and analysts talking with speculation ranging from whale repositioning to automated routing from large wallets. While these transfers don’t necessarily mean malicious intent, they do raise questions if institutional players or algorithmic tools are quietly moving liquidity before a volatility spike.
As of now SHIB is trading at $0.00001418 down 1.93% on the day. 24 hour volume is $305 million and market cap is near $8.37 billion. While the market digests these unusual transfers the chart is telling its own story.
SHIB Price Compresses: Breakout Imminent
From a technical perspective SHIB/USDT is coiling in a symmetrical triangle on the 2 hour chart and a directional move is near. Price is trapped between descending resistance at $0.00001533 and rising support at $0.00001396 with each bounce getting more and more constrained. SHIB was rejected from the 50-EMA at $0.00001475 which now acts as dynamic resistance.
Candlestick structure is bearish—small bodied candles with long upper shadows mean bulls are struggling to hold momentum. MACD is bearish with both signal lines below the zero line and further weakening short term sentiment.
Key Levels and Trade Setup
-
Resistance to watch: $0.00001475 (50-EMA), $0.00001590 (upper breakout target)
-
Immediate support: $0.00001396 (trendline base), $0.00001322 (deeper support)
Volatility trigger: Break and close outside the triangle
Treat this as a classic compression before expansion. A break above $0.00001475 may attract momentum traders looking for a run to $0.00001590. A clean break below $0.00001396 could open up $0.00001322 which was support in early May.
In short: Fundamentals are on meme and community, chart is winning. Volume is fading and price is compressing, wait for the breakout to confirm before you buy.
- Check out our free forex signals
- Follow the top economic events on FX Leaders economic calendar
- Trade better, discover more Forex Trading Strategies
- Open a FREE Trading Account
- Read our latest reviews on: Avatrade, Exness, HFM and XM
Related Articles
Sidebar rates
