Bitcoin at $66,000 as Oil Shock and Institutional Bids Pull in Opposite Directions
Bitcoin is navigating one of its most complicated macro crosscurrents of the year, holding above $66,000 while simultaneously getting
Quick overview
- Bitcoin is currently navigating complex macro conditions, holding above $66,000 despite a recent drop triggered by rising oil prices.
- Institutional demand remains strong, with significant inflows into Bitcoin ETFs after a period of outflows, indicating a potential recovery.
- Michael Saylor's ongoing Bitcoin accumulation below its cost basis may provide asymmetric demand support for the cryptocurrency.
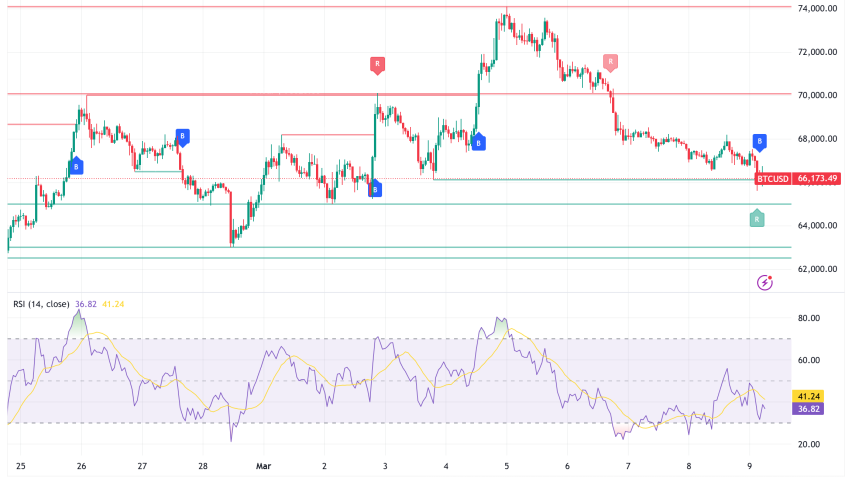
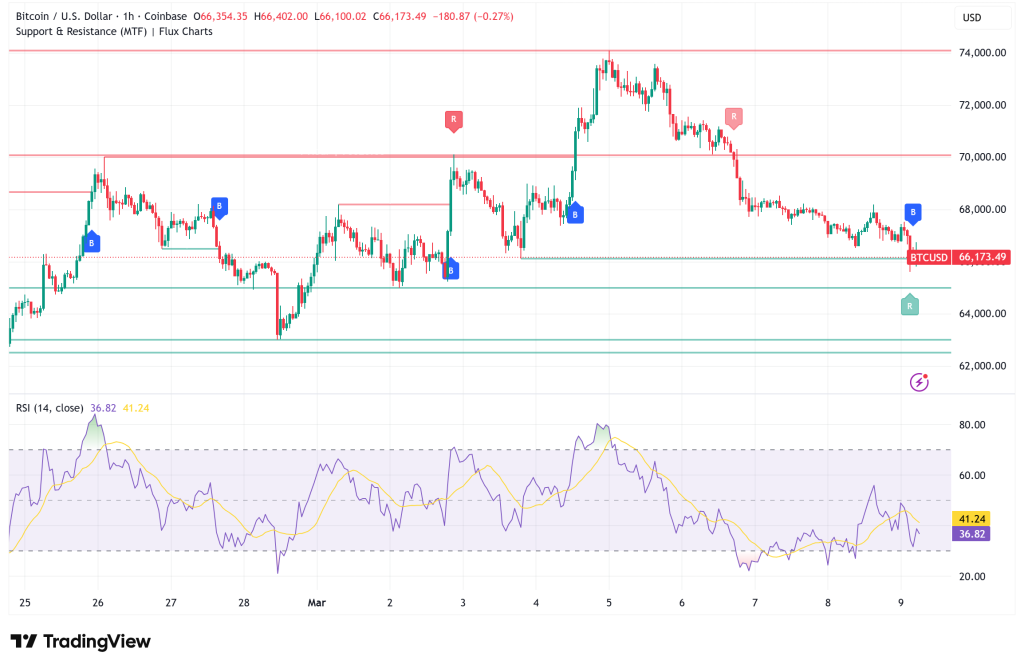
- Technical analysis suggests that Bitcoin must hold the $65,700–$66,000 range to avoid a drop to the $62,000 level.
After a geopolitical shock sent oil prices to their highest level since April 2022, Bitcoin BTC/USD is navigating one of its most complicated macro crosscurrents of the year, holding above $66,000 while simultaneously getting confirmation from institutional buyers that the underlying demand is still structurally intact.
As US futures markets opened on Sunday night, the cryptocurrency dropped as much as 1.8% in just 15 minutes, momentarily hitting $65,725 before rising to $66,272. The trigger was a spike in crude oil prices to $113.70 per barrel, which was caused by worries that Iran might disrupt production of up to 3 million barrels per day by threatening tankers in the Strait of Hormuz after US and Israeli airstrikes killed Iranian Supreme Leader Ayatollah Khamenei.
Four-Day Slide Follows a Dazzling Run to $73,770: Can Support Hold?
The decline marks a dramatic reversal from the war-driven surge in Bitcoin. As the situation intensified, Bitcoin jumped from below $64,000 to $73,770 between last Tuesday and Wednesday, riding a wave of risk-on and safe-haven emotion. However, the market’s initial excitement soon waned, and Bitcoin has lost almost 10% of its value from high to low in each of the four sessions since that peak.
After holding through several intraday tests over the weekend, the $65,700–$66,000 range is presently serving as short-term support. If this fails, the $62,000–$63,000 range, where Bitcoin consolidated in late February, will come into focus. Before bulls can credibly aim for $70,000 once more, $68,500, which also happens to be the 20-day moving average and a previous breakdown zone, is the first significant barrier to be reclaimed.
Oil’s Rapid Rise Creates Macro Headwind, But History Suggests a Short Window
The main short-term macro risk for Bitcoin is the oil price increase, which saw crude jump more than 30% in a single week. In the past, energy price shocks have caused risk-off repositioning, tightened financial conditions, and compressed risk-asset multiples. Even though it is sometimes described as a hedge, Bitcoin often trades as a high-beta risk asset during periods of severe crisis, and Sunday’s drop-as-oil-rose dynamic suggests that trend is still in place.
However, oil has already dropped from its intraday peak of $113.70 to about $105 per barrel; this cooling coincides with President Trump’s public denial of a protracted supply crisis. “We have a lot of oil,” Trump told reporters, refusing to draw from the Strategic Petroleum Reserve. That will be healed in no time.” Bitcoin may overcome its macro headwind sooner than the initial shock suggested if the de-escalation narrative continues and oil stabilizes in the $95–$105 area.
Saylor Signals Another Buy: Strategy Now Accumulates BTC Below Its Own Cost Basis
Michael Saylor might be the most significant short-term development for Bitcoin’s price rather than geopolitics. The market has learnt to consistently correlate the Strategy co-founder’s characteristic Bitcoin accumulation chart, which he posted to X on Sunday, with an impending purchase announcement. In the past week of February, the corporation paid more than $204 million for 3,015 Bitcoin, increasing its total holdings to 720,737 Bitcoin.
Crucially, Strategy is currently accumulating Bitcoin below its average cost basis of $75,985 per BTC, which means that every dollar spent at present pricing increases the unrealized loss on its treasury, which is estimated to be worth $48.1 billion. Additionally, the company’s fundamental net asset value has fallen below 1, which indicates that it is trading below the value of its own Bitcoin holdings. That discount is a signal in and of itself for institutional purchasers who are contrarians: Saylor’s ongoing accumulation at these levels offers a type of asymmetric demand support below the market.
Bitcoin ETF Inflows Flash First Back-to-Back Weekly Gains in Five Months
Beyond Strategy, this week saw a significant improvement in the overall institutional picture. After a devastating five-week outflow sequence in which $3.8 billion left US spot Bitcoin ETFs, the funds experienced net inflows of $568.45 million for the second consecutive week. ETFs last recorded consecutive weekly inflows in early October of 2025.
The daily flows were not consistent. Outflows of $228 million on Thursday and $349 million on Friday offset the strong early-week momentum of $458 million on Monday and $461 million on Wednesday, indicating that the institutional bid is genuine but not yet dominating. All things considered, the reversal pattern is similar to the circumstances that existed prior to Bitcoin’s significant re-rating occurrences in 2024, when persistent ETF accumulation came four to six weeks before new all-time highs.
To put the trajectory in a broader context, Bitcoin ETF inflows have now equaled the cumulative inflows of gold ETFs for about 15 years in less than two years. This achievement came at a period of 46% drawdowns and net outflows. Despite the current volatility, the structural demand signal is still very robust.
BTC/USD Technical Analysis: $65,700 Must Hold or the Next Floor Is $62,000
Technically speaking, the Bitcoin chart is reaching a turning point. The first line of defense is the $65,700–$66,000 range, which has been the low-water level for the weekend. Below that, the next significant support cluster is located between $62,000 and $63,000, which is also where the previous accumulation in February occurred and where the 50-day moving average is roughly located.
On the daily timescale, the four-day losing run has pushed Bitcoin’s RSI closer to oversold territory, which has traditionally come before short-covering rallies of $2,000–$4,000. According to volume research, sell-side pressure has decreased over the past two sessions, which is more in line with tiredness than escalation. The structure suggests a recovery attempt toward $69,000–$71,000 over the next one to two weeks, assuming Sunday’s low of $65,725 holds as a higher low.
Bitcoin Price Outlook: Three Scenarios for the Week Ahead
- Bull scenario — $74,000–$78,000: Saylor’s purchase is confirmed; ETF inflows continue for a third week in a row; oil retreats toward $90/bbl on diplomatic progress. Bitcoin retests the previous weekly high at $73,770 and above, and regains the 20-day moving average at $68,500. Timeframe: two to three weeks.
- Base case — $64,000–$70,000: As the market absorbs geopolitical risk, oil stabilizes in the $95–$108 range, institutional flows stay mixed, and Bitcoin fluctuates in a $6,000 band. A distinct catalyst is necessary for a new direction trend. One to four weeks is the timeline.
- Bear case: $58,000–$62,000: A disturbance in the Strait of Hormuz occurs, oil rises above $115/bbl, ETF withdrawals continue, and the $65,700 barrier is firmly broken. The $58,000–$62,000 range, where the February bottom occurred, is where Bitcoin returns. Time frame: a week or two.
- Check out our free forex signals
- Follow the top economic events on FX Leaders economic calendar
- Trade better, discover more Forex Trading Strategies
- Open a FREE Trading Account
- Read our latest reviews on: Avatrade, Exness, HFM and XM
Related Articles


Sidebar rates
Related Posts
