Ethereum Clings to $2,000 as ETF Outflows and Negative Funding Rates Deepen Bearish Pressure
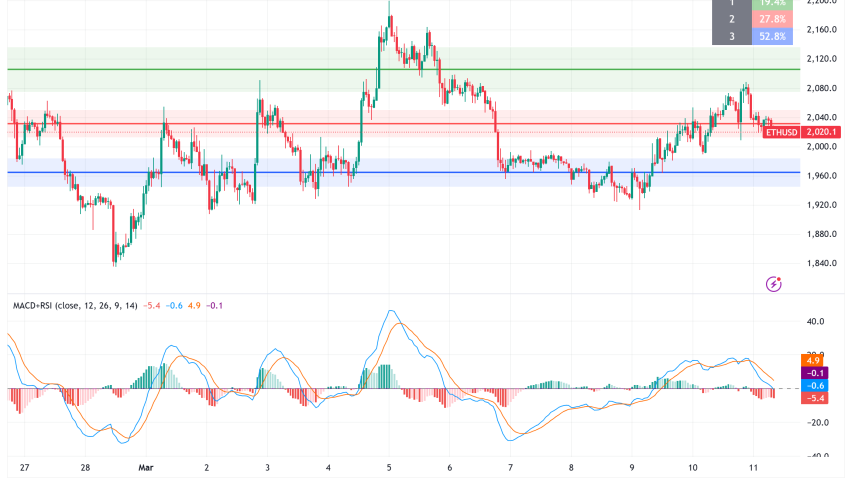
Technical recovery efforts and a cooling fundamental landscape are currently at odds with one another in the Ethereum (ETH) market. The
Quick overview
- Ethereum is currently trading near $2,000, facing challenges from institutional selling and a high beta correlation with Bitcoin.
- Recent capital flight from Ethereum ETFs has resulted in significant withdrawals, with $51 million taken out on March 10 alone.
- Technically, ETH is in a bearish triangle pattern, with indicators suggesting a potential decline if it fails to hold key support levels.
- The near-term outlook for Ethereum remains neutral-bearish, dependent on maintaining support around $2,000 and potential positive shifts in ETF flows.
Technical recovery efforts and a cooling fundamental landscape are currently at odds with one another in the Ethereum ETH/USD market. The second-largest cryptocurrency by market capitalization is currently trading close to $2,000, a slight 1% decrease over the previous day. The asset’s high beta link with Bitcoin and ongoing institutional selling are impeding a clear breakthrough, even if it has demonstrated tenacity by remaining above the psychologically critical $2,000 threshold.

Institutional Exodus: The ETF and Yield Problem
The persistent capital flight from spot the digital currency Ethereum ETFs is one of the main factors influencing Ethereum’s price. These funds experienced $51 million in withdrawals on March 10 alone, which added to a larger $225 million net loss over the course of five days.
One of the main causes of this lack of institutional demand is a yield gap. Compared to stablecoin yields on platforms like Sky Lending (previously MakerDAO), which offer 3.75%, Ethereum’s native staking return currently stands at about 2.8%. Institutions seem to be shifting capital into more stable or higher-yielding options since US ETFs are unable to efficiently exploit staking rewards.
ETH/USD Technical Analysis: Trapped in a Bearish Triangle
Technically speaking, ETH is negotiating a risky expanding triangle on the hourly charts. Several indications point to a bearish tilt even though the price is trading above the 100-hourly Simple Moving Average:
- Resistance Rejection: The $2,090 zone, which represents the 61.8% Fibonacci retracement level of the current decline from $2,200, was recently missed by the bulls.
- Momentum Shift: The Relative Strength Index (RSI) has fallen below 50, indicating that sellers are taking back control, and the Hourly MACD is picking up speed in the negative zone.
- Derivatives Sentiment: Funding rates for perpetual futures have turned negative. This reflects a general lack of confidence in a move above $2,100 and shows that traders are willing to pay more to hold short (bearish) positions.
Ethereum Price Prediction: Watching the $1,930 Pivot
Ethereum’s ability to maintain the current support floor will determine its near-term destiny as it consolidates.
- The Bearish Case: The technical structure points to a further decline toward $1,925 if ETH is unable to maintain the $1,990–$2,020 support range. As institutional outflows pick up speed, a fall below the significant $1,840 support might signal a negative continuation, possibly aiming for $1,760.
- The Bullish Case: ETH needs to close daily above the $2,120 barrier level in order for the trend to reverse. Regaining this area would disprove the present decline and pave the way for $2,220. Although it could take up to a year for these improvements to completely materialize, long-term bulls are placing their hopes on the impending Hegota fork, which promises smart accounts and the possibility to pay gas fees in non-ETH tokens.
In summary, Ethereum is in a Neutral-Bearish area. ETH is expected to continue testing purchasers’ resolve at $2,000 unless Bitcoin offers a significant upward boost or ETF flows turn positive.
- Check out our free forex signals
- Follow the top economic events on FX Leaders economic calendar
- Trade better, discover more Forex Trading Strategies
- Open a FREE Trading Account
- Read our latest reviews on: Avatrade, Exness, HFM and XM
Related Articles


Sidebar rates
Related Posts
