JSE Top 40 Slips as Oil Jumps Above $100 and War Fears Return
The FTSE/JSE Stock Exchange Top 40 wasn't off to a great start on April 20, 2026. Trading was pretty soft around the 111,500...
Quick overview
- The FTSE/JSE Top 40 index started weakly on April 20, 2026, trading around 111,500 - 111,600, down approximately 0.5 - 0.7%.
- Key factors influencing the market include the US-Iran situation and upcoming South African inflation data, which could affect the Rand and investor sentiment.
- Energy stocks like Sasol saw gains of over 6%, while platinum and gold miners faced sell-offs due to commodity volatility.
- The index is currently in a tight trading range, with key resistance at 112,750 and support around 111,000.
The FTSE/JSE Stock Exchange Top 40 wasn’t off to a great start on April 20, 2026. Trading was pretty soft around the 111,500 – 111,600 mark, with a bit of a decline in the early- to mid-session – roughly 0.5 – 0.7%. This followed a pretty wobbly Monday (down 1.1% on April 20) and a much stronger close on Friday (April 17) when it ended near 113,486, up a pretty impressive 2.38%.
The index is still up a pretty healthy amount year on year (something like 35-37%) but of course its highly sensitive to global risk sentiment and local macro releases.
Key Drivers To Keep An Eye On
- US-Iran Drama: With renewed uncertainty around the US-Iran standoff and the potential for disruptions in the Strait of Hormuz, investors are getting a bit spooked and factoring in some pretty hefty risks. This is putting the squeeze on the Rand. The sad result is that resource heavy shares (think mining and energy) that dominate the Top 40 are getting sold off in response.
- Local Issues: South African inflation data and a central bank monetary policy review due out later today could have a pretty big impact on rate expectations and the Rand. And let’s not forget business confidence surveys are also getting a good deal of attention.
What Was Happening Today In The Sectors
- Winners: Energy names like Sasol (SOL) were up strong (6%+), with British American Tobacco (BTI) and Glencore (GLN) not too far behind.
- Losers: Platinum and gold miners (like Impala Platinum, Harmony, and Sibanye Stillwater) and pretty much all of the broader resources were getting sold off in response to commodity volatility and a weaker Rand.
JSE Top 40 Technical – Where Are We?
The JSE Top 40 on the 4 hour chart is currently trading around 111,570. It’s nestled inside a symmetrical triangle formed by lower highs near 113,700 and rising support from around 110,300. I mean its really contained here – price action has tightened up and the recent candles are showing some pretty small bodies with limited follow-through. It all looks like we might be in for a bit of a volatility squeeze.
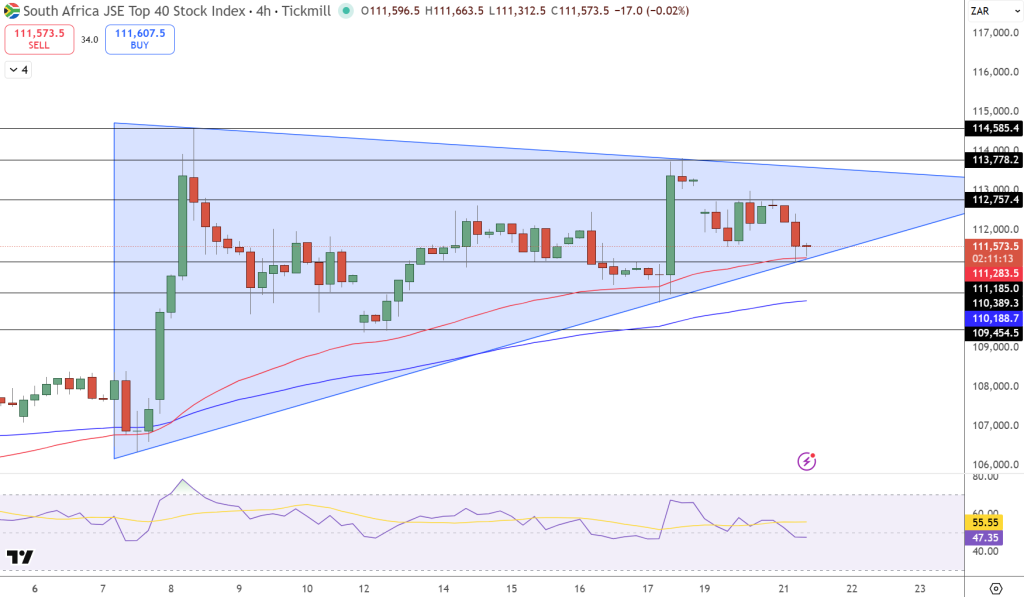
The 50 period moving average at about 111,280 is acting as immediate support, while the 200 period moving average around 110,180 is reinforcing the lower boundary of the structure. There’s been a pretty clear pattern of rejections around 113,000 – 113,700 which basically tells us there’s some pretty strong supply there, and on the flip side dips towards 111,000 seem to be attracting buyers.
Key Levels:
- Resistance: 112,750 → 113,800 → 114,600
- Support: 111,000 → 110,300 → 109,400
Trade Idea: If you can get a buy above 112,800, I reckon you should be looking to hit 114,500, but be sure to get out if it dips below 111,000.
- Check out our free forex signals
- Follow the top economic events on FX Leaders economic calendar
- Trade better, discover more Forex Trading Strategies
- Open a FREE Trading Account
- Read our latest reviews on: Avatrade, Exness, HFM and XM
Related Articles


Sidebar rates
Related Posts
