Apple Stock (AAPL) Nears Bullish Breakout – Big Move Incoming?

Quick overview
- Apple stock (AAPL) has rebounded over 15% from critical Fibonacci support at $243, indicating renewed buying interest.
- The stock is currently testing resistance at the golden ratio near $273, which is a key level for potential breakout towards the all-time high of $289.
- Momentum indicators show mixed signals, with the MACD histogram declining recently, suggesting fading upside momentum despite a bullish trend overall.
- Key support levels to watch include $262 and $243, while a failure to break above $273 could lead to a short-term pullback.
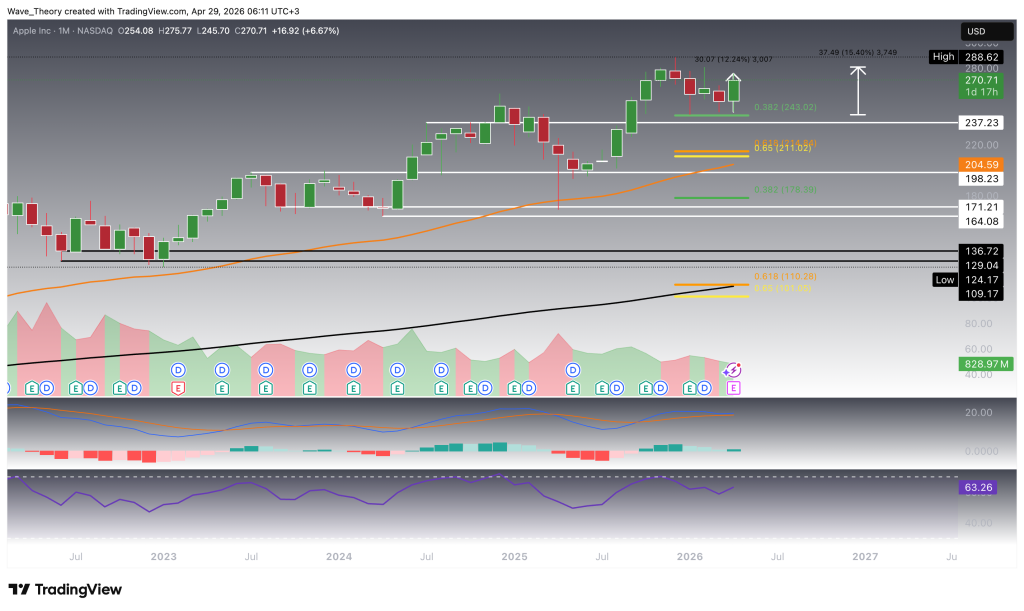
Apple stock (AAPL) has staged a strong recovery this month, gaining more than 12% following a four-month corrective phase. The stock has successfully held above key Fibonacci support levels, reinforcing the underlying bullish structure. With momentum now shifting to the upside, Apple appears positioned to challenge critical Fibonacci resistance levels. A decisive breakout could pave the way for a retest of the all-time high near $289, with the potential to extend into new highs beyond.
Apple Stock Rebounds Over 15% from Key Support
Apple (AAPL) has undergone a four-month consolidation phase, ultimately finding support at the critical 0.382 Fibonacci level around $243. From this region, the stock has staged a notable rebound of approximately 15.4%, signaling renewed buying interest. In the current month alone, Apple is already up 12.2%, indicating strengthening momentum and the potential for further upside continuation.
From a momentum perspective, conditions are improving. The MACD histogram has begun to tick higher this month following three consecutive months of bearish prints, suggesting a shift toward bullish momentum. At the same time, the MACD lines remain bullishly crossed, reinforcing the underlying strength of the trend. The RSI continues to trade in neutral territory, indicating that the stock is not overextended and retains room for further upside. Importantly, the EMA structure still displays a golden crossover, confirming that the long-term trend remains firmly bullish.
From a downside risk perspective, the $243 level remains critical. A breakdown below this 0.382 Fibonacci support would expose Apple to a deeper retracement toward the golden ratio support at $211, followed by the 50-month EMA near $205. Should these levels fail to hold, the next major Fibonacci supports are located at $178 and $110, with the 200-month EMA providing additional structural support in the lower range.
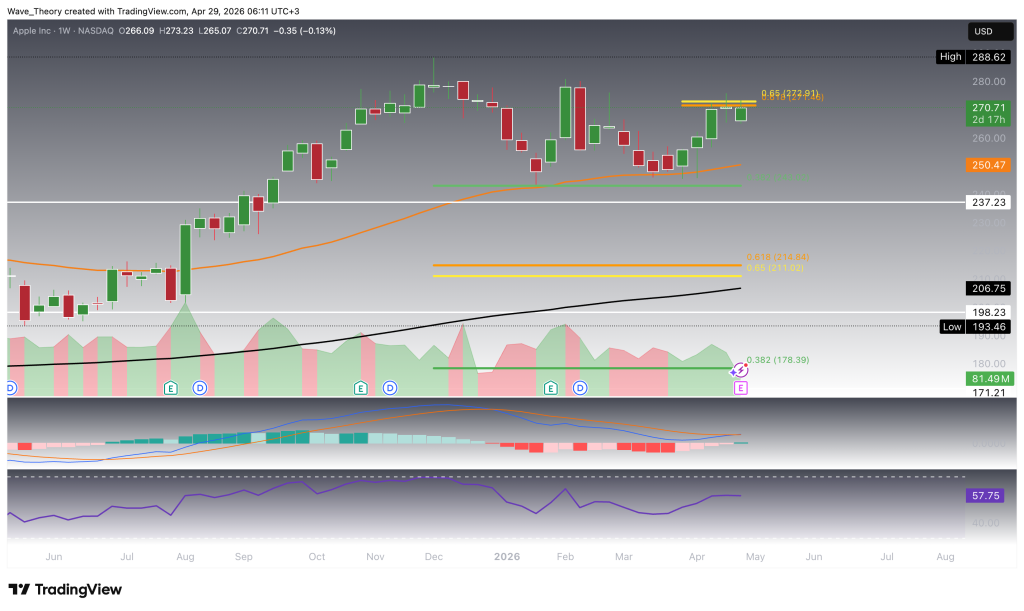
Apple Stock Tests Golden Ratio Resistance at $273
Apple (AAPL) is currently testing a critical resistance at the golden ratio near $273, marking a key inflection point for the ongoing recovery. A decisive bullish breakout above this level would likely open the path for a retest of the all-time high around $289, potentially extending the broader uptrend.
On the weekly timeframe, the technical structure remains firmly constructive. The EMA configuration continues to display a golden crossover, confirming that the mid-term trend remains bullishly intact. Momentum indicators further support this outlook: the MACD lines are bullishly crossed, while the MACD histogram has been trending higher for several consecutive weeks, signaling strengthening upside momentum. Meanwhile, the RSI remains in neutral territory, indicating that the stock is not yet overbought and retains room for further upside expansion.
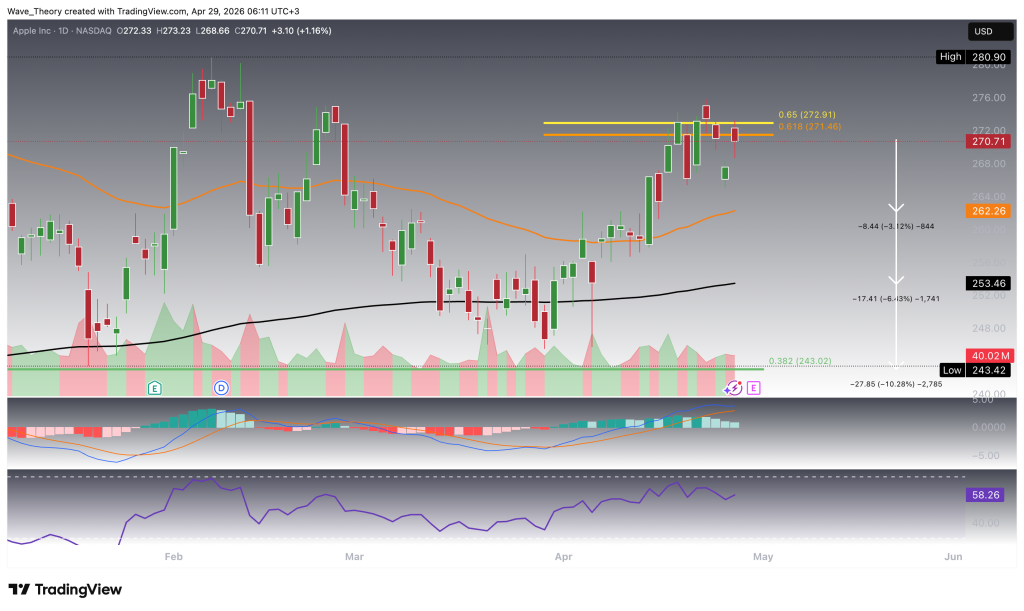
Mixed Signals on the Daily Chart as Apple Faces Rejection at $273
On the daily timeframe, Apple (AAPL) presents a mixed technical setup as price action encounters resistance at the golden ratio near $273. While the EMA structure continues to display a golden crossover—confirming a bullish trend in the short- to medium-term—momentum indicators are beginning to soften. The MACD histogram has been ticking lower for the past four days, signaling fading upside momentum, and the MACD lines are approaching a potential bearish crossover. Meanwhile, the RSI remains in neutral territory, offering no strong directional bias.
From a price action perspective, Apple is currently showing signs of bearish rejection at the $273 resistance level, highlighting the importance of this zone as a near-term ceiling. Should the stock enter a corrective phase from here, the next key support levels are located at the 50-day EMA around $262, followed by the 200-day EMA near $253.5, and the 0.382 Fibonacci support at approximately $243. This downside scenario implies a potential pullback in the range of roughly 3% to 10% from current levels.
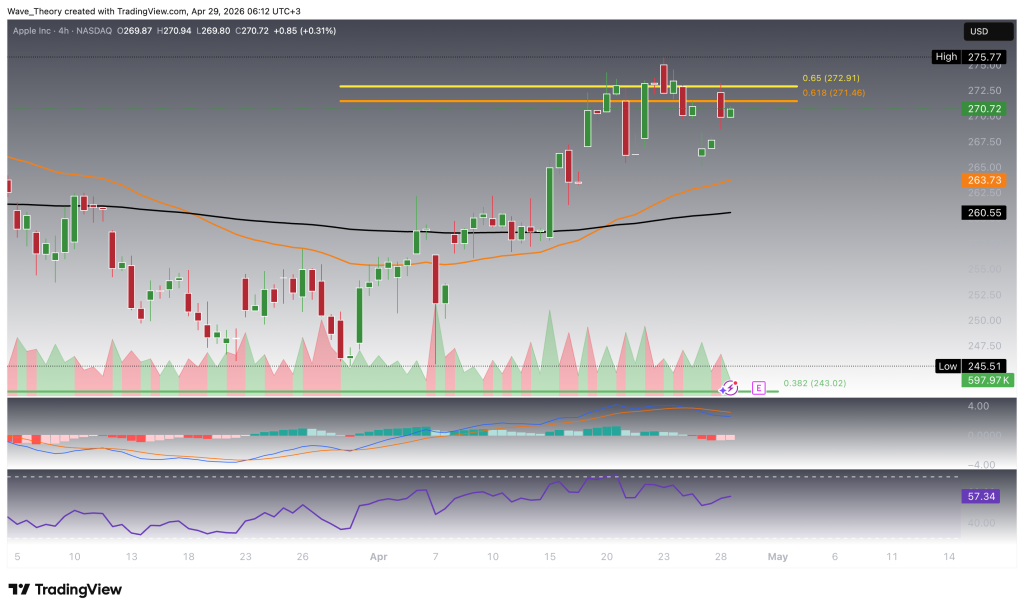
Resilience on the 4H Chart
On the 4-hour timeframe, Apple (AAPL) is showing renewed resilience, making another attempt to break above the critical golden ratio resistance at $273. The short-term structure remains constructive, as the EMAs have formed a golden crossover, confirming that the trend has shifted bullishly even on lower timeframes.
Momentum indicators further support this recovery attempt. The MACD lines remain bullishly crossed, while the MACD histogram has started to tick higher again, signaling strengthening upside momentum after a brief pause. Meanwhile, the RSI continues to trade in neutral territory, indicating no immediate overbought conditions and leaving room for further upward expansion.
Overall, this setup reflects sustained bullish pressure in the short term, with price actively challenging a key resistance level that will determine whether the current move evolves into a confirmed breakout.
Apple at a Key Breakout Zone – Levels That Matter
Apple (AAPL) remains within a firmly bullish long-term structure following a strong rebound from the $243 Fibonacci support, but is now approaching a decisive resistance zone that will determine the next major move. While higher timeframe indicators continue to support the uptrend, short-term signals show early signs of hesitation near key resistance.
Key support levels:
$262 – 50-day EMA
$253.5 – 200-day EMA
$243 – 0.382 Fibonacci support (critical level)
$211 – Golden ratio support
$205 – 50-month EMA
Key resistance levels:
$273 – Golden ratio (immediate breakout level)
$289 – All-time high target
Scenario:
Holding above $262–$243 keeps the bullish structure intact, maintaining upside potential toward $273.
A confirmed breakout above $273 would likely trigger continuation toward the all-time high at $289 and potentially beyond.
Failure at $273 could lead to a short-term pullback toward $262–$243 before the next breakout attempt.
Bottom line:
Apple is at a decisive inflection point, where strong higher timeframe bullish structure meets short-term resistance. The reaction at $273 will be key in determining whether the stock enters price discovery or undergoes another consolidation phase.
- Check out our free forex signals
- Follow the top economic events on FX Leaders economic calendar
- Trade better, discover more Forex Trading Strategies
- Open a FREE Trading Account
- Read our latest reviews on: Avatrade, Exness, HFM and XM
Related Articles


Sidebar rates
Related Posts
