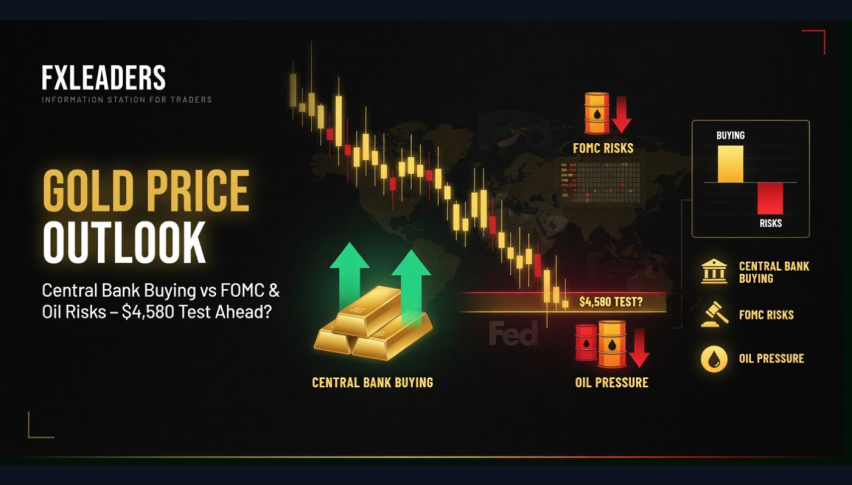
Gold Price Outlook: Central Bank Buying vs FOMC & Oil Risks – $4,580 Test Ahead?
As of April 28, 2026 (just after the morning session got underway), gold is trading in a pretty narrow range around $4,708
As of April 28, 2026 (just after the morning session got underway), gold is trading in a pretty narrow range around $4,708 – $4,710 an ounce – up a modest 0.02–0.4% on the day after that earlier dip. It was only a week ago that the four-week winning streak finally came to an end. That’s when it dropped by around 2–2.5%.
Key drivers this week
- Central Bank Demand : The Feb 2026 numbers are a real interesting story with 27 tonnes in purchases. Poland came in with a particularly big number at 20 tonnes. And the World Gold Council is now forecasting 700–850 tonnes of official acquisitions for the whole of 2026. They think all of this will be driven by central banks looking to diversify their portfolios, partly because of the risk of geopolitical strains and a move away from the dollar.
- Geopolitics & Oil: US-Iran relations are still pretty uncertain – they’ve even extended the ceasefire but talks are still at a standstill and it’s unclear what happens in the Hormuz. And if the oil price keeps going up because of this and inflation worries, that’s going to have a mixed impact on gold (gold might get a boost as a safe-haven but higher rates for longer might actually weigh on it).
- Macro Calendar:
- April 28 & 29: The FOMC is meeting and we will get a press conference from Powell. They’re not expected to change the rates – they’ve got them at 3.50–3.75% right now. But we will be keeping an eye on the tone they take on inflation.
- April 30: We will get the preliminary Q1 GDP, the PCE Deflator and also the Personal Income/Spending numbers.
- Early in May: We will get the April CPI and PPI numbers.
The stronger the data, the more concerned people might be about rates going up again – and that would probably weigh on gold. If the data is a bit softer or Powell comes out sounding a bit more dovish then we might see safe-haven buyers come back in.
Gold (XAU/USD) Technical Analysis
Well right now gold is under a fair bit of pressure on the technicals – it broke decisively through that important $4,660 level on the 4 hour chart. That level had been a real strong support but now it’s more of a bearish signal.
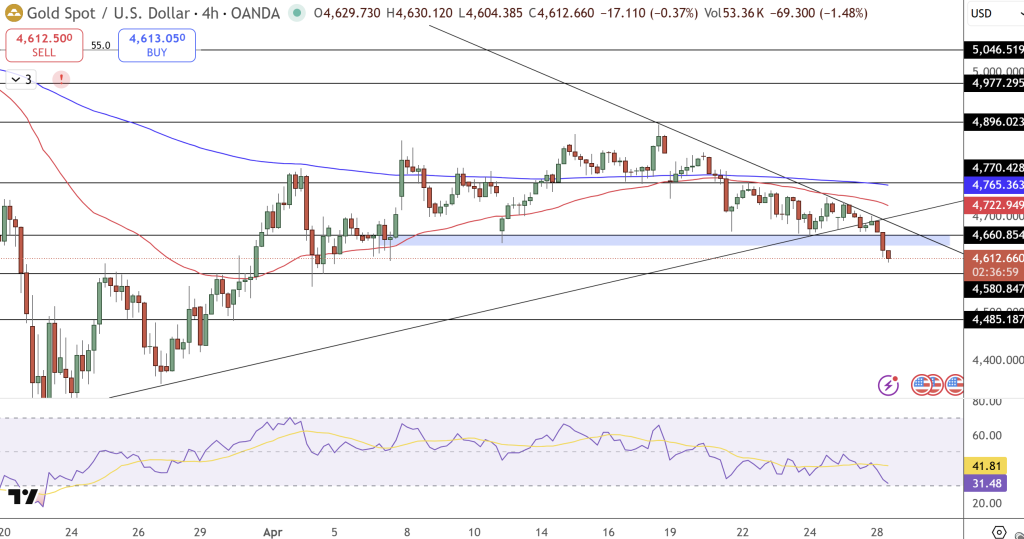
The price has dropped down to $4,612 and is looking pretty bearish – it’s making lower highs and lower lows and is even below both the 50 EMA and the 200 EMA. The RSI has dropped down into the 30s – that’s a pretty oversold reading but we don’t have a clear buy signal yet.
Key Levels:
- Resistance : $4,660–$4,720
- Support : $4,580–$4,485
Trade Idea: If we get a sell signal below $4,660 then we’d look to sell down to $4,580, with a stop-loss above $4,720.
- Check out our free forex signals
- Follow the top economic events on FX Leaders economic calendar
- Trade better, discover more Forex Trading Strategies
- Open a FREE Trading Account
- Read our latest reviews on: Avatrade, Exness, HFM and XM
Related Articles


Sidebar rates
Related Posts
