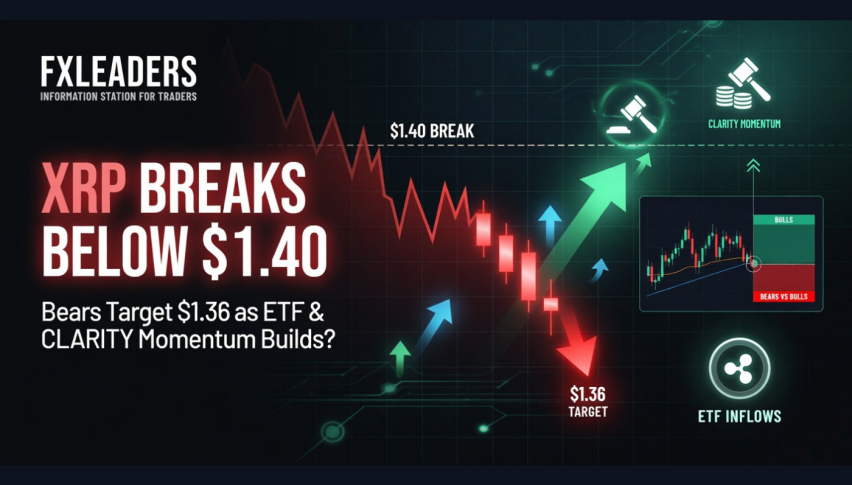
XRP Breaks Below $1.40: Bears Target $1.36 as ETF & CLARITY Momentum Builds?
As of April 28th 2026 morning trading, XRP is hovering around $1.386–$1.39 USD - a staggering 0.4 to 0.8% drop from the last 24 hours...
As of April 28th 2026 morning trading, XRP is hovering around $1.386–$1.39 USD – a staggering 0.4 to 0.8% drop from the last 24 hours. The token is currently trying to find its footing in the $1.35- $1.45 range, after briefly touching $1.50 way back in April.
Key Drivers This Week
- Regulatory Clarity: Ripple got out of the woods in late 2025 when it paid off the $125 million penalty in the Ripple-SEC case. And things just got even sweeter in March 2026 when XRP got officially classified as a commodity, finally removing that big overhang and allowing for even more institutional involvement.
- ETFs & Institutional Uptake: XRP spot ETFs have seen around $1.4 billion of cumulative cash flow, with a single week high of $119-120 million. A recent survey from Coinbase and EY-Parthenon found that 18% of institutions have already got a hold of XRP while another 25% are planning on setting some aside this year. To make matters even more interesting, Goldman Sachs chipped in with a $153.8 million position back in Q4 2025.
- Ecosystem Growth: The rollout of the RLUSD stablecoin is now complete on both XRPL and Ethereum. The numbers are looking promising – rising transaction volumes & active addresses. The word is that central banks & payment providers are getting on board with XRP Ledger for cross-border settlements. There’s also the pending CLARITY Act markup in the Senate Banking Committee that could help solidify regulatory clarity even more.
Analysts are pretty confident that this year has the potential to be a real game-changer when it comes to getting institutions on board.
XRP/USD Tech Analysis
On the 2H chart, XRP/USD has gone decisively bearish since breaking below that key $1.40 support level and the rising trendline. Price is now sitting at $1.386, making lower highs & lower lows – it’s clear the short-term outlook is down. That rejection from the $1.44-$1.45 zone is a clear turning point.
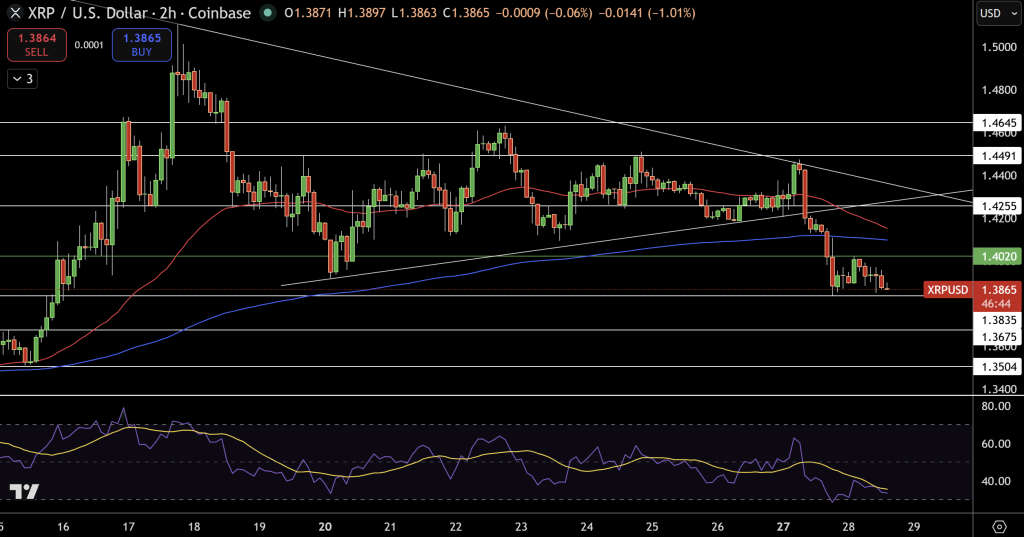
Both the 50-EMA (nearly $1.42) and 200-EMA (around $1.40) have flipped into resistance. RSI is trending in the 35-40 range – it’s a pretty clear sign that things are weak.
Key Levels
- Resistance: $1.40-$1.42 then $1.445
- Support: $1.383 then $1.367 then $1.350
Trade Idea: Sell below $1.40 with a stop loss above $1.42 and target $1.367
- Check out our free forex signals
- Follow the top economic events on FX Leaders economic calendar
- Trade better, discover more Forex Trading Strategies
- Open a FREE Trading Account
- Read our latest reviews on: Avatrade, Exness, HFM and XM
Related Articles


Sidebar rates
Related Posts
