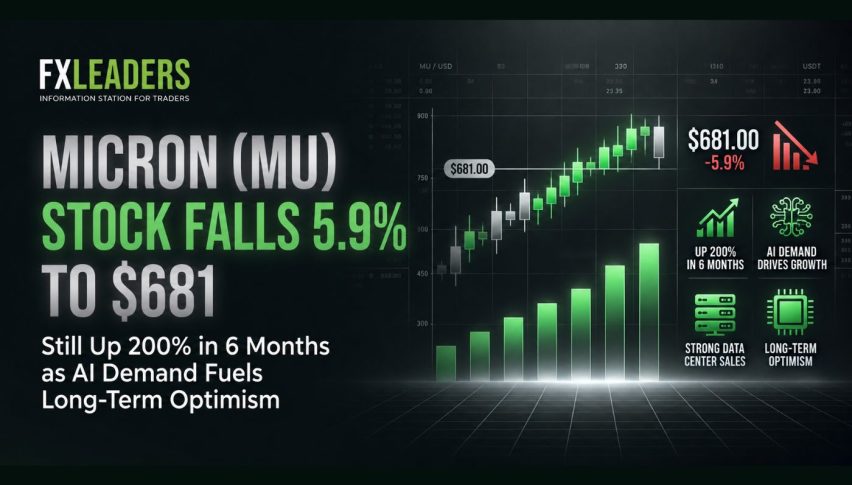
Micron (MU) Stock Falls 5.9% to $681 — Still Up 200% in 6 Months as AI Demand Fuels Long-Term Optimism
Micron Technology stock is failing to stop its negative performance of the last five days, and today it is trading at 681.54 and showing...
Quick overview
- Micron Technology stock has experienced a 5.95% decline today, continuing a negative trend over the past five days.
- Despite recent losses, the stock has shown over a 50% increase in the last thirty days and a remarkable 200% rise over the past six months.
- Investors view the current decline as a buying opportunity, driven by optimism about future AI demand and strong earnings reported at $23.86 billion.
- Analysts maintain a positive outlook, with buy ratings and price targets ranging from $500 to $1100, alongside a recent 30% increase in dividends.
Micron Technology stock is failing to stop its negative performance of the last five days, and today it is trading at 681.54 and showing losses of 5.95 percent. But before this, the stock performance has been amazing, and it has shown more than a 50 percent increase in the last thirty days. Not only this, but this stock has also shown very impressive performance in the last six months and has increased by 200 percent.
Micron company’s positive performance over so many months clearly shows that the temporary losses seen in the company’s stock are not due to the company’s personal reasons but due to an overall weakness that has come in the entire technology market. Many big companies such as NVIDIA, Intel, Google, AMD, have all been affected by this weakness and this is the same reason why Micron Technology has also been negatively affected.
The surprising thing is that instead of being afraid, investors are taking these declines as a new buying opportunity because they believe that the future of this company is very bright as AI demand is increasing day by day.
Strong Earnings and Market Impact
As we mentioned earlier, this stock has been showing very good performance for the past several months, and you can see proof of this from its fiscal second quarter 2026 report, in which it has been shown that this company made record sales of 23.86 billion dollars, which is three times higher compared to last year.
Despite the fact that it has shown negative performance in the last five days, many experts still have a very positive view about this stock, and many analysts have given it a buy rating, with a price target ranging from $1000 dollars to $1100, and the average price target is from $500 to $600 .
For example, DA Davidson, an investment banking company, gave it a price target of $1000, and other analysts like Melius Research have also increased the price target of this company’s stock because they believe that the AI demand will increase even more in the coming time, so that is why this company’s stock will also show more positive performance.
Dividends Up and AI Growth
Another good thing about this company is that they also return money to their shareholders in the form of small dividends, and they recently increased this dividend by 30 percent. Not only this, but this company is spending very heavy amounts on its new factories and technology so that it can make much more advanced and better chips for AI systems.
Therefore, with so many positive things happening, the future of this company looks bright, and the investors of this company seem satisfied with the company’s performance. That is why many analysts have given this company’s stock a buy rating.
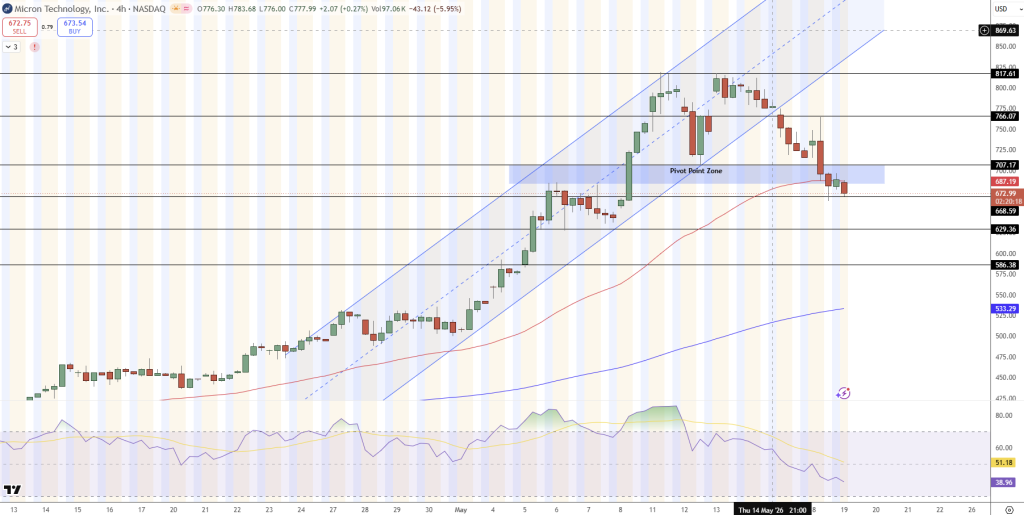
MU at $777.99 Adds 0.27%, a 4H Bounce Within the Steep Ascending Channel
Micron (MU) is trading at $777.99, which is $2.07 higher or 0.27% on the 4H NASDAQ chart. The most recent green candlesticks have held the lower blue channel boundary and pivot point zone, after the recent upward impulse that cleared a few levels of Fib extensions. Price has been honoring the red MA dynamic support around $740 to $766 with the blue MA moving higher around $668 to $707.
The structure is clean higher highs and higher lows in the rising channel that is parallel with the base at $605. There is no bearish breakout of an ending triangle with a bearish engulfing. We had a red candle pullback that respected the 0.382-0.5 Fib level after hitting 1.0 extension, resulting in a consolidation pattern that was almost like a flag.
The oscillator at the bottom (RSI-like) is cooling off of its overbought levels towards 50 to 60 with positive divergence on the recent dip, confirming lower bearish pressure with more room for price to reach overbought territory instead of reaching oversold. Resistance at $817.61 to $859.63. Support in $740 to $707. Long in trades above $780 targeting the $817-$859 levels and place stops below $740.
- Check out our free forex signals
- Follow the top economic events on FX Leaders economic calendar
- Trade better, discover more Forex Trading Strategies
- Open a FREE Trading Account
- Read our latest reviews on: Avatrade, Exness, HFM and XM
Related Articles

Sidebar rates
Related Posts
