Boeing (BA) Stock Analysis: Undervalued Recovery Giant or Massive Bull Trap?

Quick overview
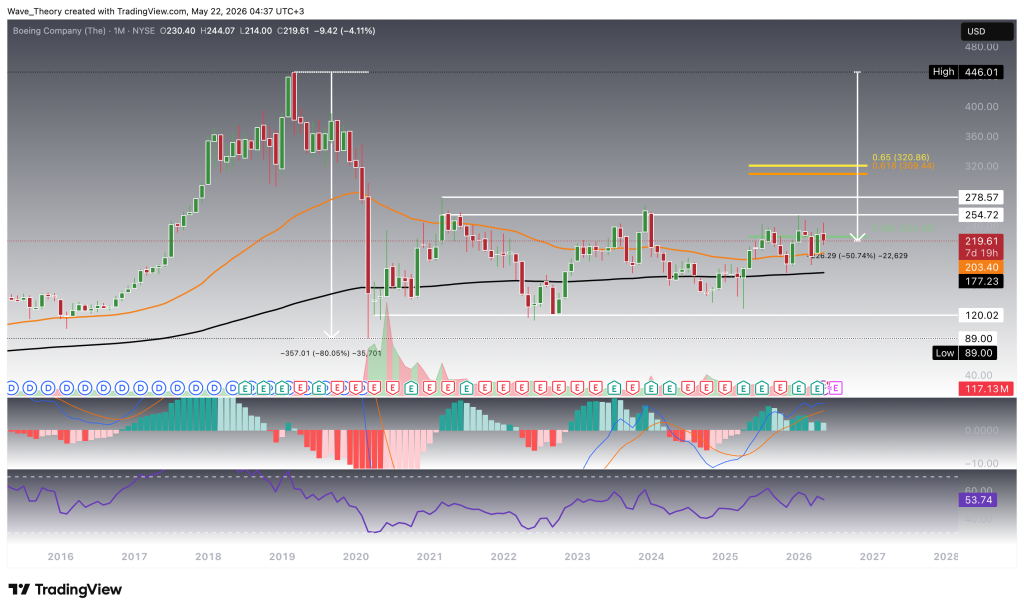
- Boeing stock is currently about 51% below its 2018 all-time high, having recovered from a significant decline between 2018 and 2020.
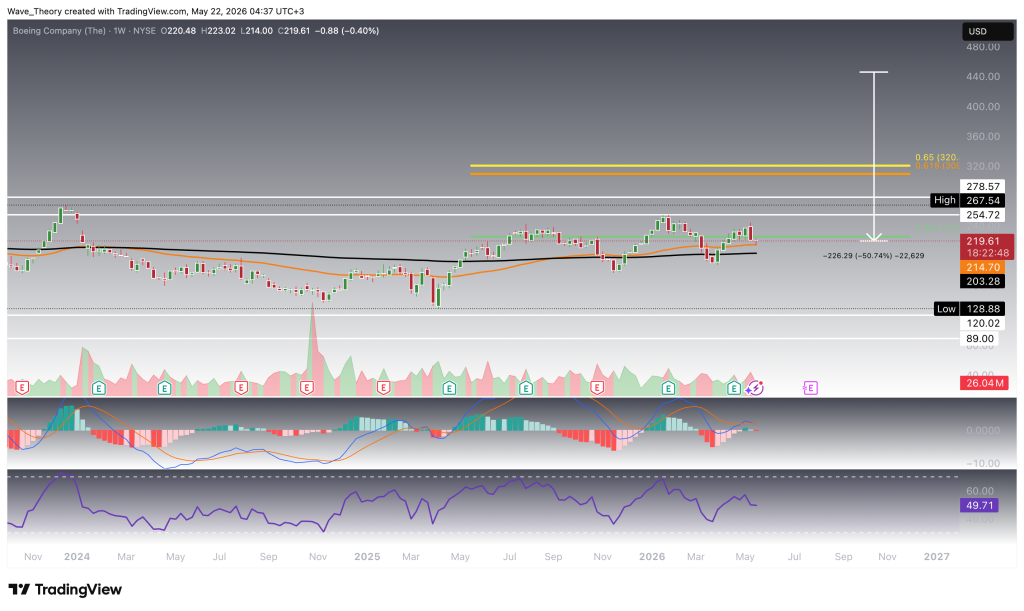
- The stock is facing critical resistance at the 0.382 Fibonacci level around $225, which could determine its next major price movement.
- While long-term trends remain bullish, momentum indicators are showing signs of weakening, indicating potential indecision in the market.
- Boeing maintains strong support between $89 and $120, which is crucial for the ongoing recovery trend.
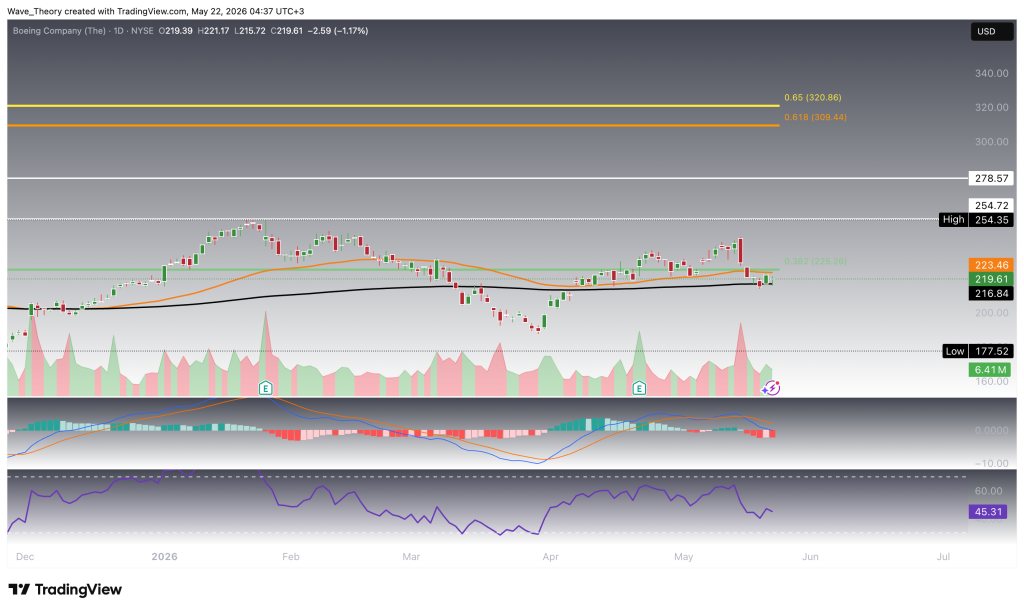
Similar Technical Outlook Emerges on Boeing’s Daily Chart
Boeing stock (NYSE: BA) displays a similarly mixed technical structure on the daily timeframe, reflecting the ongoing battle between the broader recovery trend and weakening short-term momentum.
From a trend-following perspective, the daily EMAs continue to maintain a bullish golden crossover, confirming that the short- to medium-term trend structure remains constructive. Despite the recent pullback, the underlying trend has therefore not yet transitioned into a confirmed bearish reversal.
However, momentum indicators continue to deteriorate on the lower timeframe. The MACD lines remain bearishly crossed on the daily chart, while the MACD histogram has started ticking lower again today, signaling increasing bearish momentum and weakening buying pressure in the near term.
Meanwhile, the Relative Strength Index (RSI) continues to fluctuate in neutral territory, offering neither a clear bullish nor bearish directional bias at current levels.
To the downside, Boeing stock continues to find significant long-term support within the broader demand zone between $89 and $120 — a historically critical accumulation region that previously marked the cycle bottom during Boeing’s multi-year correction phase. As long as Boeing remains structurally above this major support region, the broader long-term recovery structure technically remains intact despite the current consolidation and weakening momentum signals on the lower timeframes.
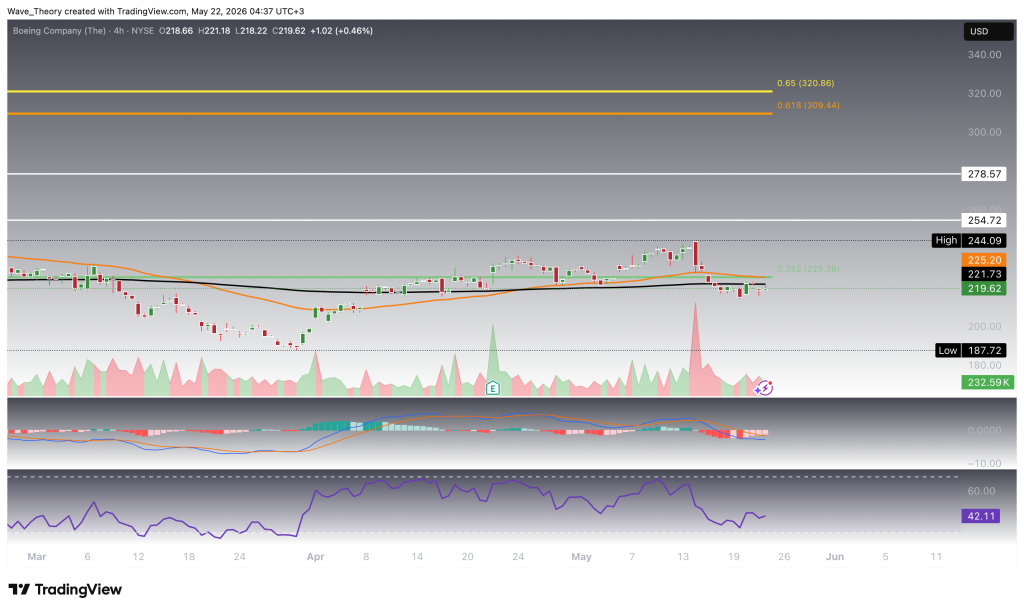
Boeing Stock Displays Relatively Bullish Signals on the 4H Chart
On the 4-hour timeframe, Boeing stock (NYSE: BA) currently presents a comparatively more bullish technical structure relative to the higher timeframes, suggesting that short-term momentum may gradually begin stabilizing despite broader mixed signals across the weekly and daily charts.
The EMAs continue to maintain a bullish golden crossover on the 4H chart, confirming that the short-term trend structure remains constructive and technically favors the bulls for the time being. This indicates that Boeing stock continues to trade within an intact short-term uptrend despite recent consolidation near key resistance levels.
In addition, the MACD histogram has started to trend higher again, signaling improving short-term momentum and a gradual reduction in bearish pressure. However, despite this developing momentum shift, the MACD lines themselves remain bearishly crossed, indicating that bullish confirmation has not yet been fully established and that the recovery attempt still requires additional validation.
Meanwhile, the Relative Strength Index (RSI) continues to fluctuate in neutral territory, reflecting the absence of extreme bullish or bearish momentum conditions at current price levels.
Overall, the 4H chart suggests that Boeing stock may be attempting to build a short-term bullish reversal structure. However, as long as the MACD lines remain bearishly crossed and higher timeframe resistance levels continue to cap upside momentum, the broader market structure remains in a technically sensitive position.
BOEING
Boeing Stock Analysis Summary & Key Levels
Boeing stock (NYSE: BA) continues to maintain its broader long-term recovery structure following its historic decline from the 2018 all-time high near $446 to the cycle bottom around $89. While the higher timeframe trend remains structurally constructive due to persistent EMA golden crossovers across multiple timeframes, momentum indicators increasingly reflect weakening bullish momentum and growing market indecision.
Technically, Boeing is currently trading at a critical inflection point. The stock continues to face strong resistance at the 0.382 Fibonacci level near $225, while the major horizontal resistance zone between $255 and $279 remains the most important barrier for bulls to overcome. A decisive breakout above this region could trigger a continuation rally toward the golden ratio resistance near $320 — a critical macro resistance level whose breakout would effectively invalidate Boeing’s multi-year corrective structure and potentially open the path toward a retest of the all-time high near $446.
On the downside, Boeing maintains significant long-term support between $89 and $120, which continues to represent the broader macro accumulation zone and structural foundation of the ongoing recovery trend.
Overall, Boeing stock remains technically bullish from a long-term trend perspective, but weakening momentum indicators across the weekly and daily timeframes suggest that the market is approaching a decisive phase where either a major breakout or renewed corrective pressure could emerge in the coming months.
- Check out our free forex signals
- Follow the top economic events on FX Leaders economic calendar
- Trade better, discover more Forex Trading Strategies
- Open a FREE Trading Account
- Read our latest reviews on: Avatrade, Exness, HFM and XM
Related Articles


Sidebar rates
Related Posts
